Fig. 1
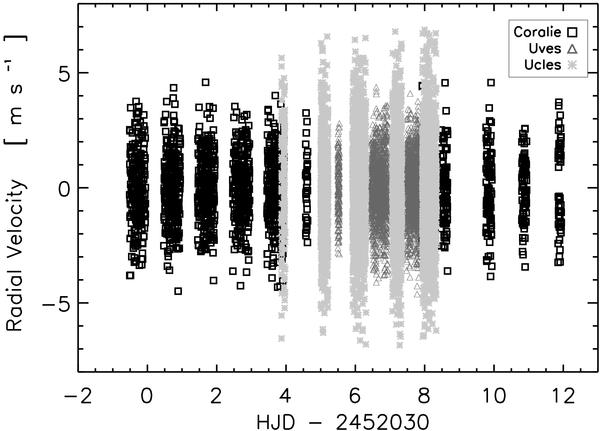
Combined time series of CORALIE, UVES and UCLES. One can see that the UCLES data, which were taken in Australia, fill several gaps in the time series of the CORALIE and UVES data, taken in Chile. This will allow a better detection of p-modes frequencies by reducing the daily aliases in the spectrum of the star (see text for details).
Current usage metrics show cumulative count of Article Views (full-text article views including HTML views, PDF and ePub downloads, according to the available data) and Abstracts Views on Vision4Press platform.
Data correspond to usage on the plateform after 2015. The current usage metrics is available 48-96 hours after online publication and is updated daily on week days.
Initial download of the metrics may take a while.