Fig. 1
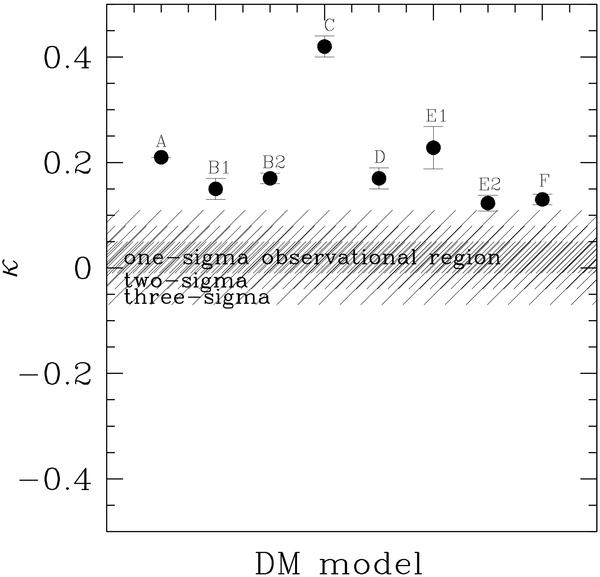
The slope of the mass-luminosity relation, κ (Eq. (1)), for the models listed in Table 1. The observational constraints with confidence intervals are depicted as hatched regions (1, 2, and 3σ region). Satellites with a larger dark-matter mass are on average more luminous such that the mass-luminosity relation has κ > 0. However, the observational constraints lie in the region κ ≈ 0 (see Table 1). The hypothesis that the data are consistent with any one of the models can be discarded with very high (at least 3σ, or more than 99.7 per cent) confidence.
Current usage metrics show cumulative count of Article Views (full-text article views including HTML views, PDF and ePub downloads, according to the available data) and Abstracts Views on Vision4Press platform.
Data correspond to usage on the plateform after 2015. The current usage metrics is available 48-96 hours after online publication and is updated daily on week days.
Initial download of the metrics may take a while.