Fig. 5
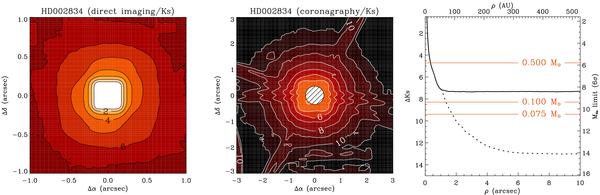
Example of 6-σ detection limits reached for a K = 4.7 mag A0V star at 52.7 pc (HD 2834) using direct imaging (left panel) and coronagraphy (middle panel). Detection limits for the direct and coronagraphic image are given in 2 × 2 and 6 × 6 arcsec2 fields around the star, respectively. The hatched area on the coronagraphic image represents the occulting mask with a diameter of 0″̣7. Classic 1-dimensional 6-σ detection limits (right panel) are extracted from the direct image detection limit map (plain line) and the coronagraphy detection limit map (dotted line) as explained in Sect. 4.3. Mass limits (red lines) are obtained by interpolating Baraffe et al.’s (1998) evolutionary model for a given stellar age (here, 700 Myr).
Current usage metrics show cumulative count of Article Views (full-text article views including HTML views, PDF and ePub downloads, according to the available data) and Abstracts Views on Vision4Press platform.
Data correspond to usage on the plateform after 2015. The current usage metrics is available 48-96 hours after online publication and is updated daily on week days.
Initial download of the metrics may take a while.