Fig. 5
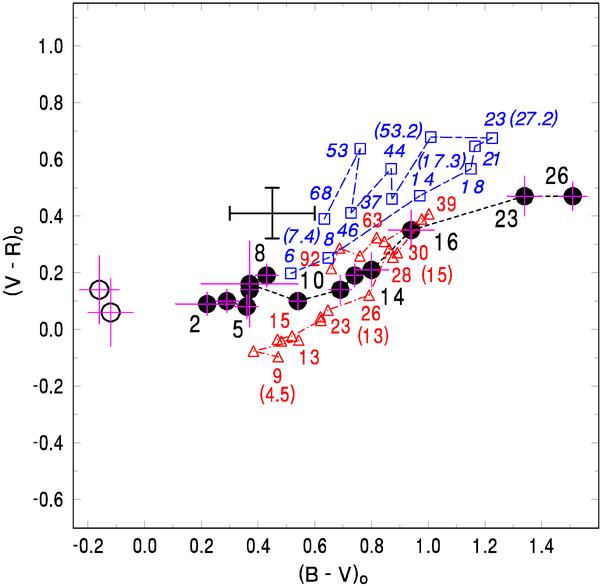
(B − V)0 vs. (V − R)0 diagram of the OA of GRB 060218. Solid circles denote the data by Mirabal et al. (2006). Open circles mark the colors determined from the combination of Mirabal’s et al. and UVOT data. The points are connected by a line to show the time evolution of the color indices. The large cross denotes the centroid and standard deviations of the colors of the ensemble of OAs for t − T0 < 10 d (Šimon et al. 2001, 2004a). Open triangles and open boxes mark the synthetic colors of SN 1998bw and type Ic SNe, respectively. The numbers at the points denote t − T0 in days for z = 0.03345; it starts from the appropriate GRBs in the case of GRB 060218 and SN 1998bw. In the case of type Ic SNe, t − T0 = 0 d is set to 10 d before the time of the V band peak light. The numbers in brackets refer to SN 1998bw and type Ic SNe evolving twice as fast and by a factor of 1.2 slower, respectively. See Sect. 3 for details. (This figure is available in color in electronic form.)
Current usage metrics show cumulative count of Article Views (full-text article views including HTML views, PDF and ePub downloads, according to the available data) and Abstracts Views on Vision4Press platform.
Data correspond to usage on the plateform after 2015. The current usage metrics is available 48-96 hours after online publication and is updated daily on week days.
Initial download of the metrics may take a while.