Fig. 4
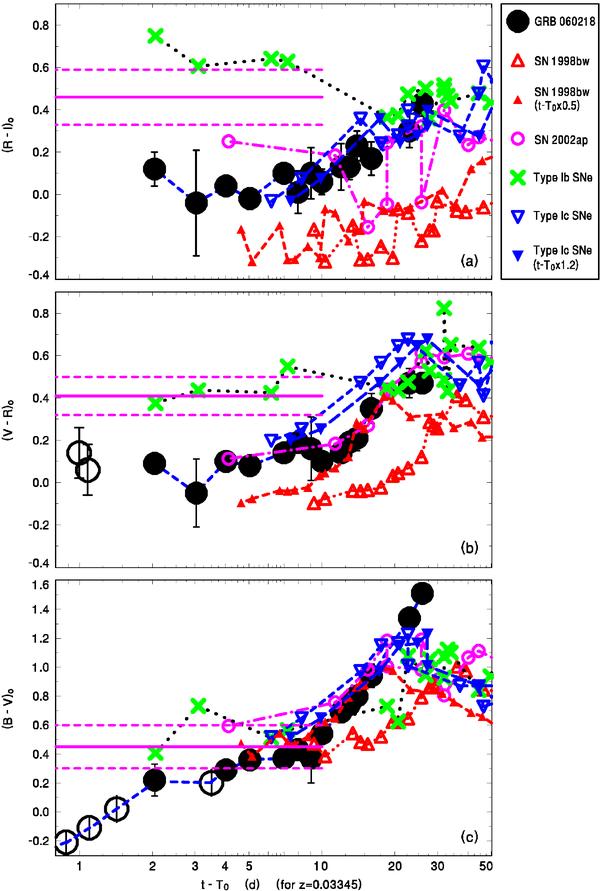
Time evolution of the color indices of the OA of GRB 060218. Large solid and open circles denote the data by Mirabal et al. (2006) and from UVOT, respectively. The points are connected by lines for convenience. The horizontal solid line with the dashed error bars marks the mean color indices of the ensemble of OAs, determined by Šimon et al. (2004a). The synthetic colors of SN 1998bw, SN 2002ap, the group of type Ib SNe, and the group type Ic SNe (Poznanski et al. 2002), with the bands and t − T0 recalculated for z = 0.03345, appropriate for GRB 060218, are also plotted. The colors of OAs are found to be independent of the redshift. See Sect. 3 for details. The time stretch factor, which is discussed in Sect. 4.3, is not included. (This figure is available in color in electronic form.)
Current usage metrics show cumulative count of Article Views (full-text article views including HTML views, PDF and ePub downloads, according to the available data) and Abstracts Views on Vision4Press platform.
Data correspond to usage on the plateform after 2015. The current usage metrics is available 48-96 hours after online publication and is updated daily on week days.
Initial download of the metrics may take a while.