Fig. 3
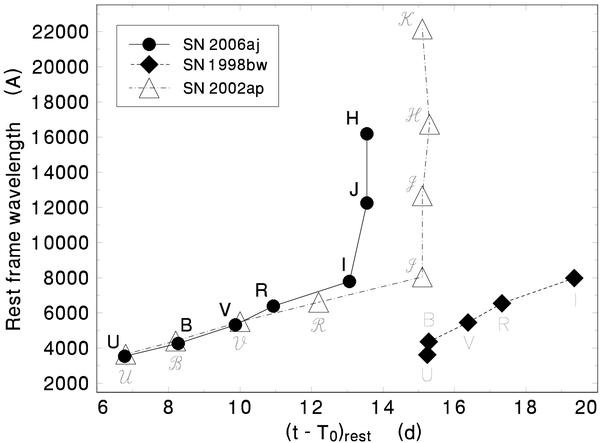
The time of the peak light of SN vs. wavelength. Both the effective wavelength and the time interval (t − T0)rest are expressed in the rest frame. The filter used is marked for each data point. Three type Ic hypernovae with a sufficient coverage by the data are displayed. The points are connected by lines for convenience. See Sect. 3 for details.
Current usage metrics show cumulative count of Article Views (full-text article views including HTML views, PDF and ePub downloads, according to the available data) and Abstracts Views on Vision4Press platform.
Data correspond to usage on the plateform after 2015. The current usage metrics is available 48-96 hours after online publication and is updated daily on week days.
Initial download of the metrics may take a while.