Fig. 2
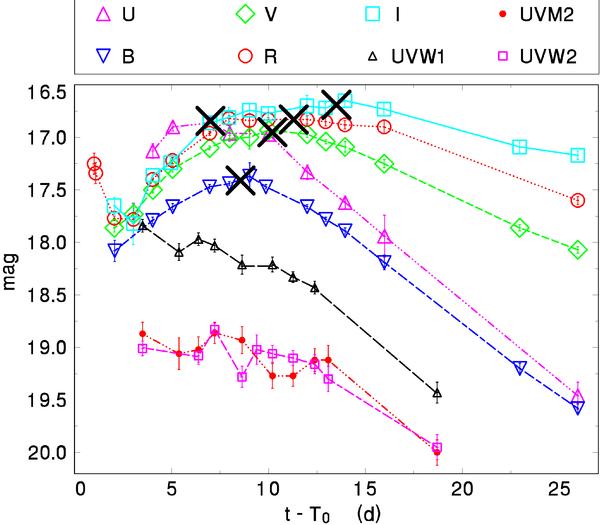
The light curves of the OA of GRB 060218 in the individual bands. The time interval t − T0 is in the observer frame. This diagram concentrates on the evolution of SN 2006aj, so most data from Phase I are skipped to avoid overcrowding. The data are corrected for the Galactic extinction and contribution of the host galaxy. The UBVRI data come from Mirabal et al. (2006), the rest obtained with UVOT. The points are connected by lines for convenience. The large crosses denote the time of the peak light in a given filter (for UBVRI). See Sect. 3 for details. (This figure is available in color in electronic form.)
Current usage metrics show cumulative count of Article Views (full-text article views including HTML views, PDF and ePub downloads, according to the available data) and Abstracts Views on Vision4Press platform.
Data correspond to usage on the plateform after 2015. The current usage metrics is available 48-96 hours after online publication and is updated daily on week days.
Initial download of the metrics may take a while.