Fig. 10
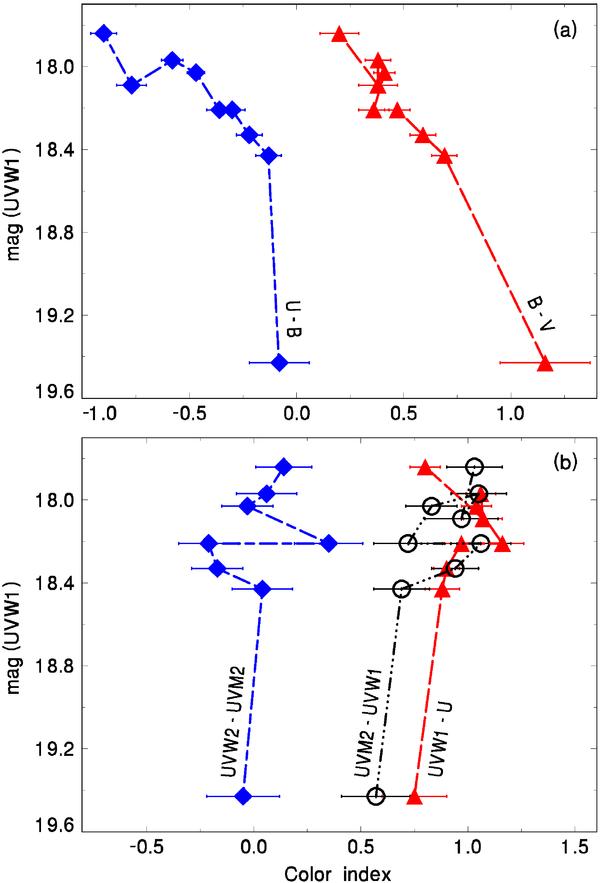
The color index vs. magnitude diagram for SN 2006aj (3.5 d < t − T0 < 18.7 d). a) The colors in the band longward of the region, in which line blanketing dominates. b) The colors in the region with line blanketing. Error bars of the color index are included. The data were corrected for the reddening and light contribution of the host galaxy. See Sect. 3 for details. (This figure is available in color in electronic form.)
Current usage metrics show cumulative count of Article Views (full-text article views including HTML views, PDF and ePub downloads, according to the available data) and Abstracts Views on Vision4Press platform.
Data correspond to usage on the plateform after 2015. The current usage metrics is available 48-96 hours after online publication and is updated daily on week days.
Initial download of the metrics may take a while.