Fig. 1
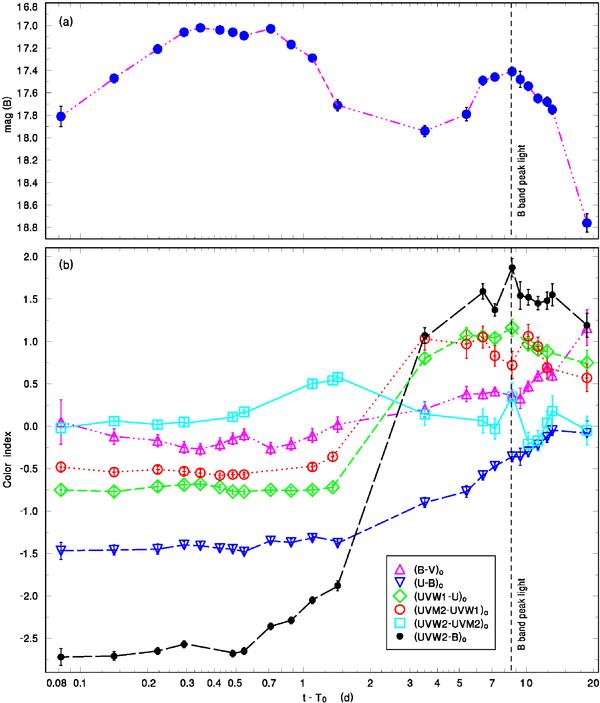
The B band light curve a) and the time evolution, in the observer frame, of the color indices b) of the OA of GRB 060218 (UVOT data). The points are connected by lines for convenience and may not precisely reflect the complicated profile of the variations in the data gaps. The data were corrected for the reddening and light contribution of the host galaxy as described in Sect. 3. (This figure is available in color in electronic form.)
Current usage metrics show cumulative count of Article Views (full-text article views including HTML views, PDF and ePub downloads, according to the available data) and Abstracts Views on Vision4Press platform.
Data correspond to usage on the plateform after 2015. The current usage metrics is available 48-96 hours after online publication and is updated daily on week days.
Initial download of the metrics may take a while.