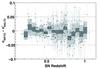
Fig. 4
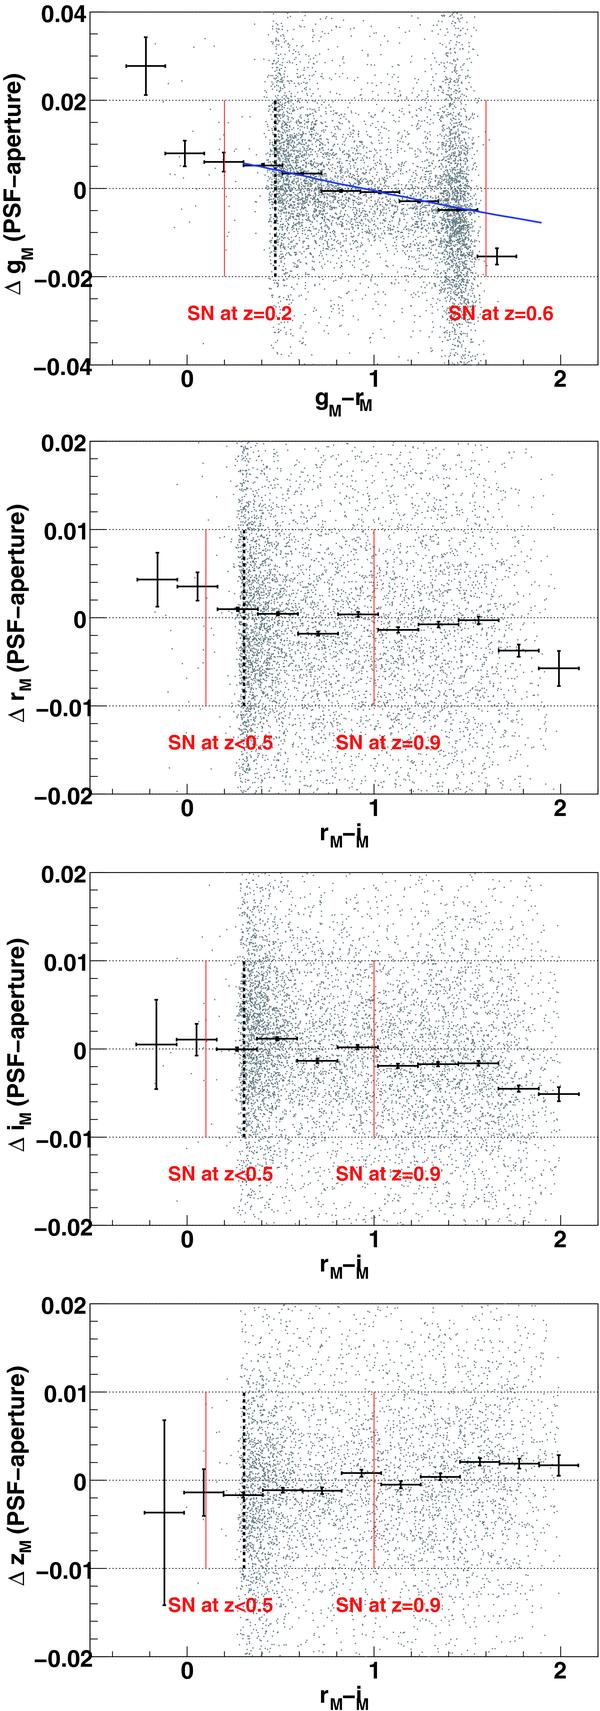
Differences between PSF and aperture magnitudes of the tertiary stars in the gMrMiMzM bands as a function of the colour of stars (gray dots). The black points with error bars represent the average deviation and its uncertainty in bins of colour. Typical SNe colours at maximum light are marked with red dotted vertical lines. The blue curve on the top panel shows the effect of the PSF wavelength dependent correction on synthetic magnitudes obtained with PHOENIX stellar models. The colours of BD+17 4708 are marked by the black vertical lines.
Current usage metrics show cumulative count of Article Views (full-text article views including HTML views, PDF and ePub downloads, according to the available data) and Abstracts Views on Vision4Press platform.
Data correspond to usage on the plateform after 2015. The current usage metrics is available 48-96 hours after online publication and is updated daily on week days.
Initial download of the metrics may take a while.