Fig. 26
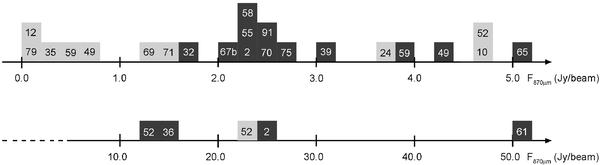
Methanol masers: 870 μm flux density at the peak of the condensations in the directions of which 6.7 GHz methanol masers are detected. The nearby bubbles are identified by their number (e.g. “12” for N12). The black condensations also contain one or several UC H ii regions; no UC H ii regions have been detected in the direction of the light grey condensations. Note that the scale along the two axes differ by a factor ten.
Current usage metrics show cumulative count of Article Views (full-text article views including HTML views, PDF and ePub downloads, according to the available data) and Abstracts Views on Vision4Press platform.
Data correspond to usage on the plateform after 2015. The current usage metrics is available 48-96 hours after online publication and is updated daily on week days.
Initial download of the metrics may take a while.