Fig. 23
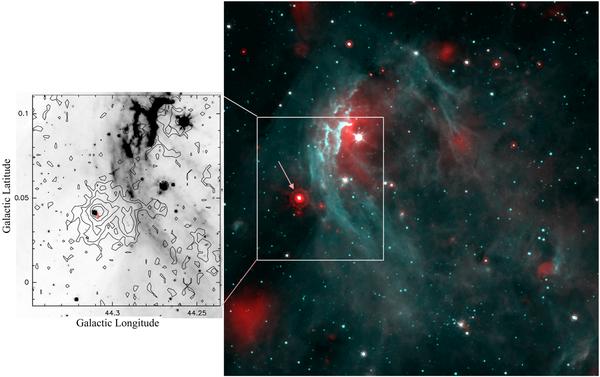
N91. Left: the 870 μm contour levels (0.1, 0.25, 0.5, 1.0, 1.5 Jy/beam) are superimposed on the Spitzer-GLIMPSE 8 μm image. The red cross gives the position of the methanol maser. Right: colour composite image with the 24 μm emission in red and the 8 μm emission in turquoise. The arrow points to a bright 24 μm source, which is also a UC H ii region.
Current usage metrics show cumulative count of Article Views (full-text article views including HTML views, PDF and ePub downloads, according to the available data) and Abstracts Views on Vision4Press platform.
Data correspond to usage on the plateform after 2015. The current usage metrics is available 48-96 hours after online publication and is updated daily on week days.
Initial download of the metrics may take a while.