Fig. 21
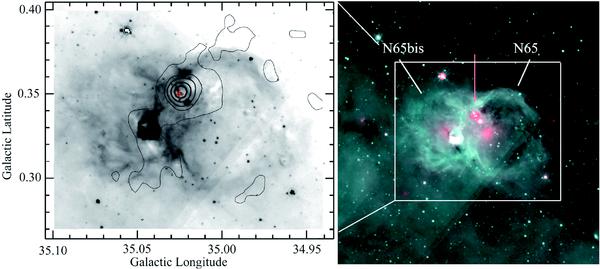
N65 & N65bis. Left: contours of the 870 μm emission superimposed on the 8.0 μm image (σ = 0.04 Jy/beam; contour levels 1, 5, 15, 30, 50σ); Right: Spitzer-GLIMPSE 8 μm emission in turquoise and -MIPSGAL 24 μm emission in red. We see both the faint emission from the cold dust associated with the collected material surrounding N65, and a bright condensation between the two H ii regions, suggesting a zone of compression. The bright condensation contains an UC H ii region and a class II methanol maser. The arrow points to a bright 24 μm source which is also a UC H ii region. The red cross gives the position of the methanol maser.
Current usage metrics show cumulative count of Article Views (full-text article views including HTML views, PDF and ePub downloads, according to the available data) and Abstracts Views on Vision4Press platform.
Data correspond to usage on the plateform after 2015. The current usage metrics is available 48-96 hours after online publication and is updated daily on week days.
Initial download of the metrics may take a while.