Fig. 17
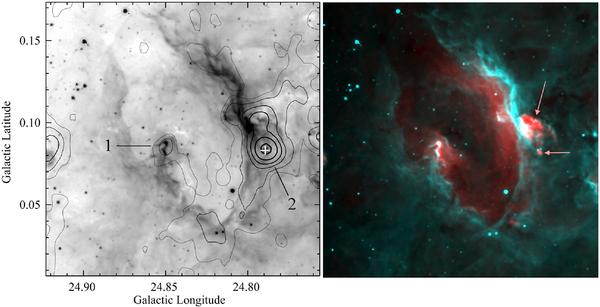
N36: left: contours of the 870 μm emission superimposed on the 8.0 μm image (σ = 0.09 Jy/beam; contour levels 1, 3, 5, 10, 20, 60σ). The white cross shows the position of the methanol maser. Right: Spitzer-GLIMPSE 8.0 μm emission in turquoise and MAGPIS 20-cm emission in red. The arrows identify the compact and UC H ii regions.
Current usage metrics show cumulative count of Article Views (full-text article views including HTML views, PDF and ePub downloads, according to the available data) and Abstracts Views on Vision4Press platform.
Data correspond to usage on the plateform after 2015. The current usage metrics is available 48-96 hours after online publication and is updated daily on week days.
Initial download of the metrics may take a while.