Fig. 14
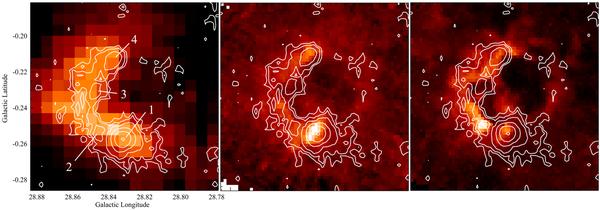
The CO environment of N49: the 870 μm contour levels (0.1, 0.2, 0.5, 1.0, 1.5, and 2.0 Jy/beam) are superimposed on the Galactic Ring Survey 13CO (1 − 0) emission (Jackson et al. 2006) integrated over all velocities (left), on the B&W 12CO (3 − 2) emission integrated over the velocity (middle), and on the B&W 12CO (3 − 2) peak intensity map (right). The dense dust condensation #1 is almost absent from the CO peak intensity map, whereas condensation #2, associated with the UC H ii region, is bright (presumably a temperature effect). The CO (1 − 0) and (3 − 2) emissions integrated over velocity are more similar to the 870 μm emission. However, the dust condensation #1 is much brighter at 870 μm than it is in CO.
Current usage metrics show cumulative count of Article Views (full-text article views including HTML views, PDF and ePub downloads, according to the available data) and Abstracts Views on Vision4Press platform.
Data correspond to usage on the plateform after 2015. The current usage metrics is available 48-96 hours after online publication and is updated daily on week days.
Initial download of the metrics may take a while.