Fig. 13
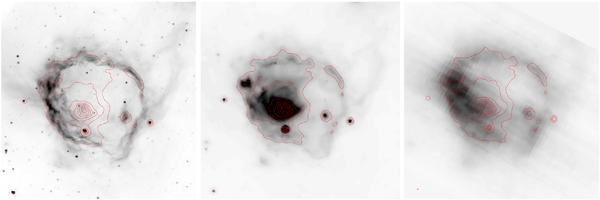
N4: comparison of the distribution of various types of dust grains; left: emission of the PAHs at 8.0 μm from the PDR. Middle: emission at 24 μm of the hot grains from the ionized region (the red contours correspond to this emission). Right: emission at 70 μm from colder grains, distinct from these emitting at 24 μm, and probably situated in the PDR.
Current usage metrics show cumulative count of Article Views (full-text article views including HTML views, PDF and ePub downloads, according to the available data) and Abstracts Views on Vision4Press platform.
Data correspond to usage on the plateform after 2015. The current usage metrics is available 48-96 hours after online publication and is updated daily on week days.
Initial download of the metrics may take a while.