Fig. 11
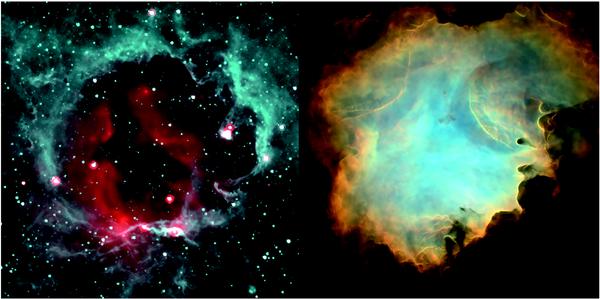
N12: left: colour image with the Spitzer-GLIMPSE image at 8 μm in turquoise and the Spitzer-MIPSGAL image at 24 μm in red. This bubble appears, at first glance, to be rather circular; but the ionization front that limits the central cavity shows many structures. This is indicative of density inhomogeneities in the medium surrounding the bubble. Right: synthetic optical image of a simulated H ii region evolving in a turbulent molecular cloud (Henney et al. 2010). The [NII] 6584 Å emission appears in red, the Hα 6563 Å emission in green, and the [OIII] 5007 Å emission in blue.
Current usage metrics show cumulative count of Article Views (full-text article views including HTML views, PDF and ePub downloads, according to the available data) and Abstracts Views on Vision4Press platform.
Data correspond to usage on the plateform after 2015. The current usage metrics is available 48-96 hours after online publication and is updated daily on week days.
Initial download of the metrics may take a while.