Fig. 1
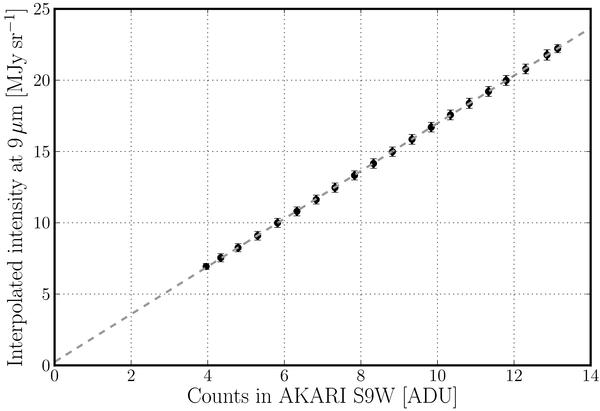
Comparison between the estimated 9 μm intensity and the observed one in ADUs for IRC S9W band. Instead of plotting about 148 500 data points all the averages (dots) and standard deviations (error bars) are calculated at 0.5-ADU intervals. The gray dashed line shows the result of the linear least-squares fit to the 148 500 points.
Current usage metrics show cumulative count of Article Views (full-text article views including HTML views, PDF and ePub downloads, according to the available data) and Abstracts Views on Vision4Press platform.
Data correspond to usage on the plateform after 2015. The current usage metrics is available 48-96 hours after online publication and is updated daily on week days.
Initial download of the metrics may take a while.