Fig. 2
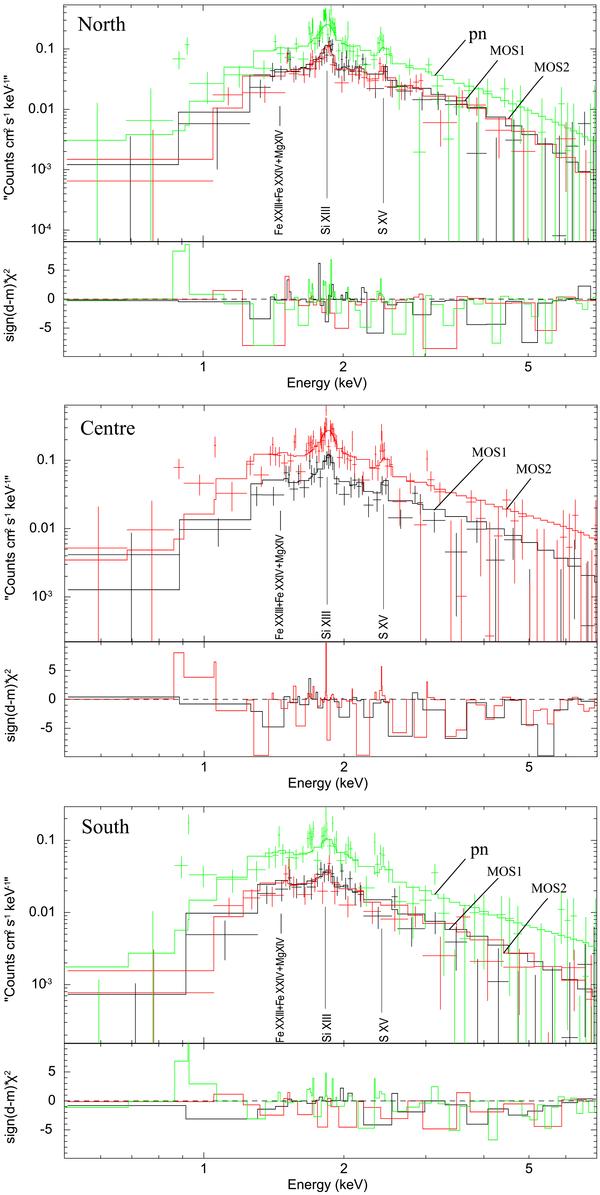
Combined XMM-Newton EPIC PN and MOS X-ray spectra for the regions north, center, and south of G304.6 + 0.1 and residuals (botton panel in each spectrum). The solid line indicates the best-fit pshock+PL model (see Table 1). The identified lines, mostly blended, correspond to atomic transitions of Fe XXIII+Fe XXIV+Mg XIV, Si XIII, and S XV.
Current usage metrics show cumulative count of Article Views (full-text article views including HTML views, PDF and ePub downloads, according to the available data) and Abstracts Views on Vision4Press platform.
Data correspond to usage on the plateform after 2015. The current usage metrics is available 48-96 hours after online publication and is updated daily on week days.
Initial download of the metrics may take a while.