Fig. 8
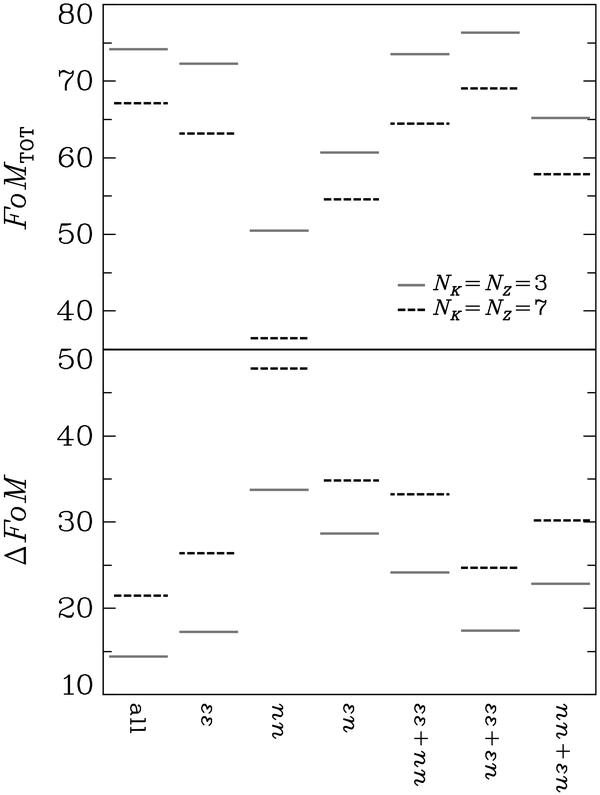
Upper panel: the FoMTOT for different subsets of correlations that are observable from a galaxy survey with galaxy shape and number density measurements. The Fisher matrix has been computed for the total data set containing all correlations, i.e. these results represent the information content of the subsets as a part of the total signal. Black dashed bars correspond to a marginalisation over NK = NZ = 7 nuisance parameters, grey solid bars to NK = NZ = 3 nuisance parameters. The labels on the abscissa indicate the different combinations of correlations used, where ϵn stands for the cross-correlations between number density and ellipticity. Lower panel: difference Δ FoM, see (48), for the same subsets as above. This difference can be understood as a measure of the depletion of information in the subsets due to the marginalisation over nuisance parameters.
Current usage metrics show cumulative count of Article Views (full-text article views including HTML views, PDF and ePub downloads, according to the available data) and Abstracts Views on Vision4Press platform.
Data correspond to usage on the plateform after 2015. The current usage metrics is available 48-96 hours after online publication and is updated daily on week days.
Initial download of the metrics may take a while.