Fig. C.2
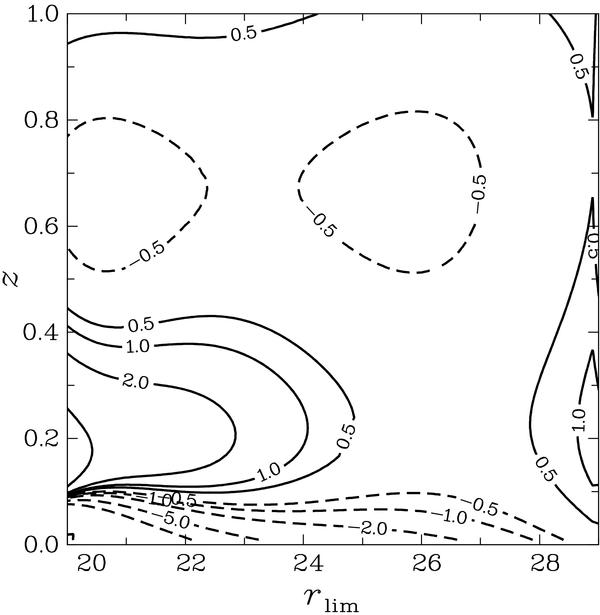
Percentage deviation of the simplified fit as defined in (C.2) and (C.3) from the original fits described by (C.1) and shown in the upper panel of Fig. C.1. The contour levels correspond to the percentages given on the curves. Negative deviations are indicated by dashed contours. Note that across most of the parameter plane the modulus of the deviation is less than 1%.
Current usage metrics show cumulative count of Article Views (full-text article views including HTML views, PDF and ePub downloads, according to the available data) and Abstracts Views on Vision4Press platform.
Data correspond to usage on the plateform after 2015. The current usage metrics is available 48-96 hours after online publication and is updated daily on week days.
Initial download of the metrics may take a while.