Fig. 1
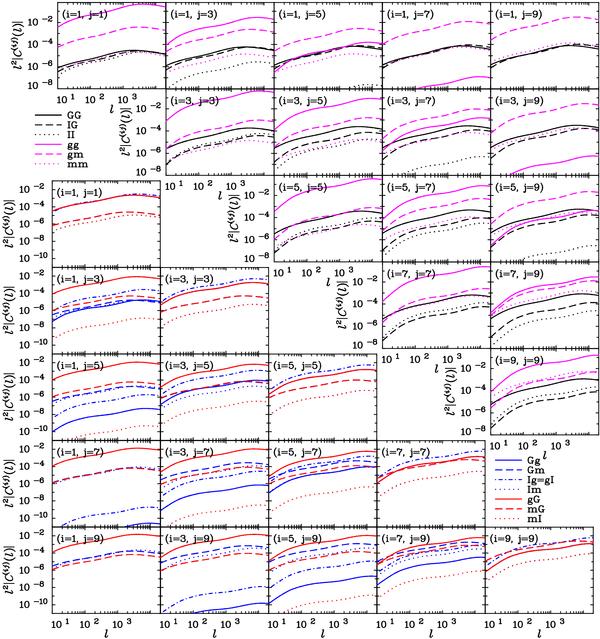
Fiducial power spectra for all considered correlations. The upper right
panels depict the contributions to ϵϵ (in black) and
nn (in magenta) correlations. The lower left panels
show the contributions to correlations between number density fluctuations
and ellipticity. Since we only show correlations  with i ≤ j, we make
in this plot a distinction between nϵ (in red; number density
contribution in the foreground, e.g. gG) and ϵn (in blue; number
density contribution in the background, e.g. Gg) correlations. In each sub-panel a
different tomographic redshift bin correlation is shown. For clarity only odd bins
are displayed. In the upper right panels the usual cosmic shear
signal (GG) is shown as a black solid lines; the intrinsic alignment GI term is
shown by the black dashed lines; the intrinsic alignment II term is shown by the
dotted black line; the usual galaxy clustering signal (gg) is shown by the magenta
solid line; the cross correlation between galaxy clustering and lensing
magnification (gm) is shown by the magenta dashed line; the lensing magnification
correlation functions (mm) are shown by the magenta dotted line. In the
lower left panels the solid blue line shows the correlation between
lensing shear and galaxy clustering (Gg); the blue dashed line shows the correlation
between lensing shear and lensing magnification (gm); the blue dot-dashed line shows
the correlation between intrinsic alignment and galaxy clustering (Ig or
equivalently gI); the red solid line shows the correlation between galaxy clustering
and lensing shear (gG), which is equivalent to the blue solid line with redshift bin
indices i and j reversed; similarly the red dashed
line shows the correlation between lensing magnification and lensing shear (mG), for
cases where the magnification occurs at lower redshift than the shear
(i < j); finally the dotted line shows the
correlation between lensing magnification and intrinsic alignment (mI).
with i ≤ j, we make
in this plot a distinction between nϵ (in red; number density
contribution in the foreground, e.g. gG) and ϵn (in blue; number
density contribution in the background, e.g. Gg) correlations. In each sub-panel a
different tomographic redshift bin correlation is shown. For clarity only odd bins
are displayed. In the upper right panels the usual cosmic shear
signal (GG) is shown as a black solid lines; the intrinsic alignment GI term is
shown by the black dashed lines; the intrinsic alignment II term is shown by the
dotted black line; the usual galaxy clustering signal (gg) is shown by the magenta
solid line; the cross correlation between galaxy clustering and lensing
magnification (gm) is shown by the magenta dashed line; the lensing magnification
correlation functions (mm) are shown by the magenta dotted line. In the
lower left panels the solid blue line shows the correlation between
lensing shear and galaxy clustering (Gg); the blue dashed line shows the correlation
between lensing shear and lensing magnification (gm); the blue dot-dashed line shows
the correlation between intrinsic alignment and galaxy clustering (Ig or
equivalently gI); the red solid line shows the correlation between galaxy clustering
and lensing shear (gG), which is equivalent to the blue solid line with redshift bin
indices i and j reversed; similarly the red dashed
line shows the correlation between lensing magnification and lensing shear (mG), for
cases where the magnification occurs at lower redshift than the shear
(i < j); finally the dotted line shows the
correlation between lensing magnification and intrinsic alignment (mI).
Current usage metrics show cumulative count of Article Views (full-text article views including HTML views, PDF and ePub downloads, according to the available data) and Abstracts Views on Vision4Press platform.
Data correspond to usage on the plateform after 2015. The current usage metrics is available 48-96 hours after online publication and is updated daily on week days.
Initial download of the metrics may take a while.