Fig. 1
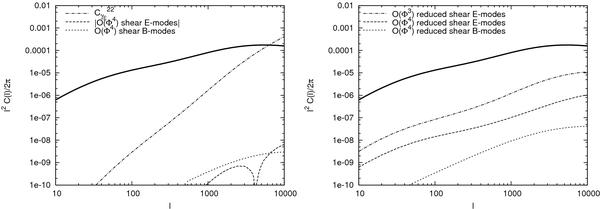
Linear order shear power spectrum (thick solid
line; Eq. (12)) and corrections up
to  .
Left. The dashed/short dashed lines show the fourth order
corrections to the E/B-mode shear power spectra that arise from relaxing the Born
approximation and including lens-lens coupling in the calculation of the shear
(Sect. 3.1; cf. Cooray & Hu 2002). The E-mode correction is negative at
small l and positive for l ≳ 4200. The
dashed-dotted line illustrates term
.
Left. The dashed/short dashed lines show the fourth order
corrections to the E/B-mode shear power spectra that arise from relaxing the Born
approximation and including lens-lens coupling in the calculation of the shear
(Sect. 3.1; cf. Cooray & Hu 2002). The E-mode correction is negative at
small l and positive for l ≳ 4200. The
dashed-dotted line illustrates term  (cf.
Eq. (32)) which contributes to the
E-mode shear correction, the divergency is cancelled by Eq. (36). Right. The
dashed/short dashed lines show the combined forth order corrections to the reduced
shear E/B-mode power spectra (Sect. 3.2,
Table 1). The dashed-dotted line shows the
third order correction to the reduced shear E-mode power spectrum. We assume a
source redshift
zα = zβ = 1
and use the transfer function from Efstathiou et al.
(1992), the fitting formula of Smith et al.
(2003) for the non-linear matter power spectrum, and the fitting formula of
Scoccimarro & Couchman (2001) for
the non-linear matter bispectrum. This figure assumes a flat ΛCDM cosmology with
(Ωm,Ωb,σ8,h,n) = (0.3,0.05,0.9,0.7,1)
to enable comparison with previous calculations.
(cf.
Eq. (32)) which contributes to the
E-mode shear correction, the divergency is cancelled by Eq. (36). Right. The
dashed/short dashed lines show the combined forth order corrections to the reduced
shear E/B-mode power spectra (Sect. 3.2,
Table 1). The dashed-dotted line shows the
third order correction to the reduced shear E-mode power spectrum. We assume a
source redshift
zα = zβ = 1
and use the transfer function from Efstathiou et al.
(1992), the fitting formula of Smith et al.
(2003) for the non-linear matter power spectrum, and the fitting formula of
Scoccimarro & Couchman (2001) for
the non-linear matter bispectrum. This figure assumes a flat ΛCDM cosmology with
(Ωm,Ωb,σ8,h,n) = (0.3,0.05,0.9,0.7,1)
to enable comparison with previous calculations.
Current usage metrics show cumulative count of Article Views (full-text article views including HTML views, PDF and ePub downloads, according to the available data) and Abstracts Views on Vision4Press platform.
Data correspond to usage on the plateform after 2015. The current usage metrics is available 48-96 hours after online publication and is updated daily on week days.
Initial download of the metrics may take a while.