Fig. 26
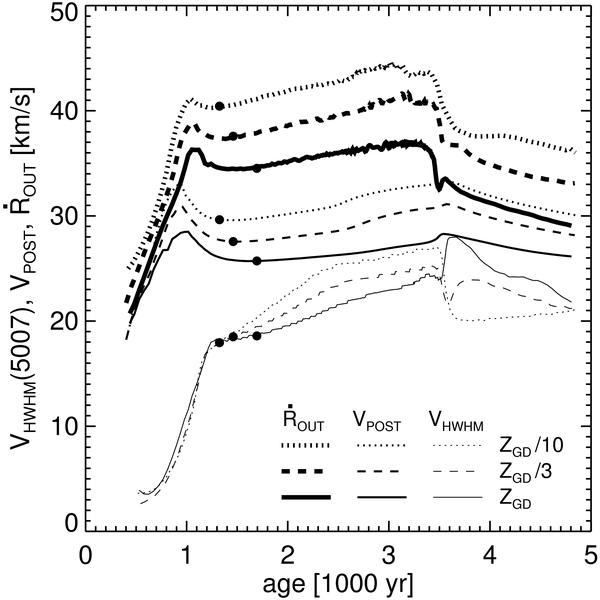
Three different expansion velocities of a PN: VHWHM of the spatially integrated [O iii] 5007 Å line profile, the post-shock velocity, Vpost, behind the outer shock at Rout, and the shock velocity, Ṙout, itself. Shown is the complete time evolution of these velocities for three sequences with the 0.625 M⊙ central-star model and different metallicities (see figure legend). The filled circles mark the snapshots shown in Fig. 24, which correspond also to the moment of maximum [O iii] emission. The relevant model parameters are listed in Table 3 where also the values of VHWHM, Vpost, and Ṙout for the 3 ZGD sequence, not plotted for clarity, are given. The bumps at age ≃1000 years are due to the optically thick/thin transition.
Current usage metrics show cumulative count of Article Views (full-text article views including HTML views, PDF and ePub downloads, according to the available data) and Abstracts Views on Vision4Press platform.
Data correspond to usage on the plateform after 2015. The current usage metrics is available 48-96 hours after online publication and is updated daily on week days.
Initial download of the metrics may take a while.