Fig. 24
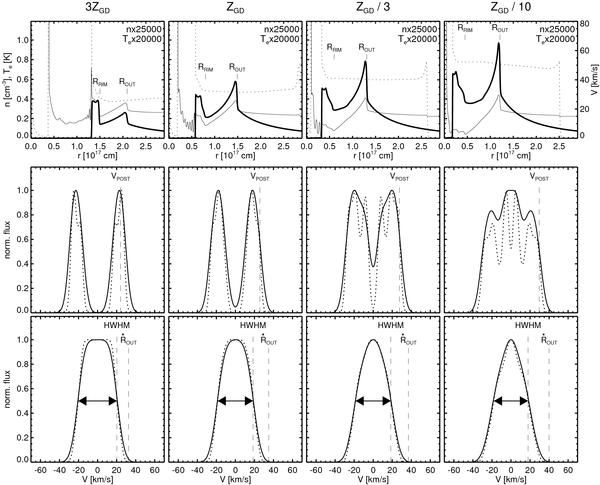
Composite figure showing one snapshot taken at maximum 5007 Å brightness along each of the four 0.625 M⊙ sequences (α = 2), with the metallicities indicated over the panels. Details of the models are listed in Table 3. Top panels: structures of the models: run of ion density (thick solid line), flow velocity (thin solid line), and electron temperature (dotted line) with radius. Densities and temperatures are normalised and must be multiplied with the factors given in each panel. The radial positions, Rout, of the nebular outer shock and of the rim, Rrim are also marked in each panel. The central star is at r = 0 cm. The electron temperature spikes seen at larger radii are caused by the ionisation fronts, and the jumps at the inner nebular edges mark the positions of the contact discontinuity/conduction fronts. Middle panels: normalised spatially resolved [O iii] 5007 Å and thermally broadened line profiles (dotted line) as seen through a central numerical aperture with a diameter of 1 × 1016 cm (corresponding to 0″̣67 at 1 kpc), and additionally broadened by a Gaussian of 10 km s-1 FWHM (solid line) in order to simulate a typical instrumental broadening. The maximum velocity behind the outer shock at Rout, Vpost, is indicated by vertical dashed lines. Bottom panels: [O iii] 5007 Å line profiles as integrated over the whole nebula (dotted line), and additionally broadened by a Gaussian of 10 km s-1 FWHM (solid line). Two vertical dashed lines in each panel indicate the HWHM and the shock velocity, Ṙout, respectively.
Current usage metrics show cumulative count of Article Views (full-text article views including HTML views, PDF and ePub downloads, according to the available data) and Abstracts Views on Vision4Press platform.
Data correspond to usage on the plateform after 2015. The current usage metrics is available 48-96 hours after online publication and is updated daily on week days.
Initial download of the metrics may take a while.