Fig. 6
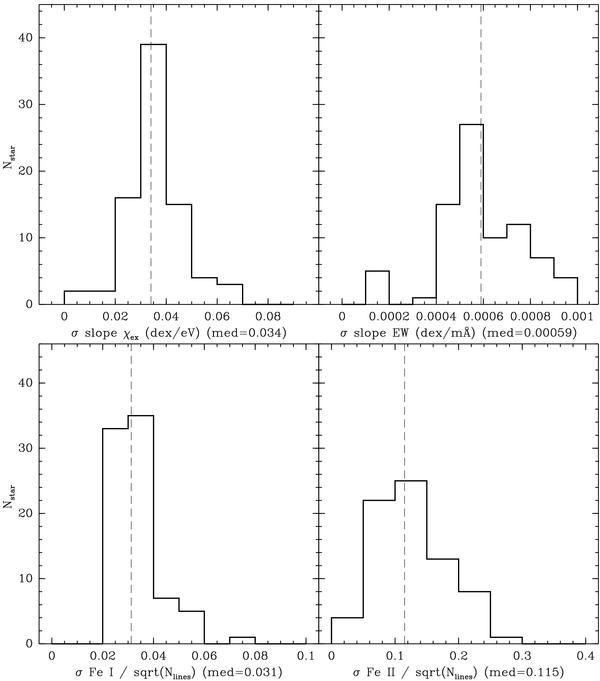
Distribution of errors of the stellar parameter diagnostics for the total sample. upper panels: propagated error on the measurement of the slope of Fe i abundances versus the excitation potential of the line (σ(slopeχ) left), and versus the line strength (σ(slopeW) left). lower panels: error on the mean Fe i and Fe ii abundances as measured by the dispersion around the mean divided by the square root of the number of lines of each species.
Current usage metrics show cumulative count of Article Views (full-text article views including HTML views, PDF and ePub downloads, according to the available data) and Abstracts Views on Vision4Press platform.
Data correspond to usage on the plateform after 2015. The current usage metrics is available 48-96 hours after online publication and is updated daily on week days.
Initial download of the metrics may take a while.