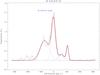
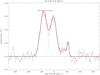
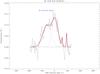
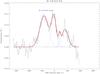
Fig. 9

CO, HCO+, SiO, and H13CO+ average spectra over the angular size of M − 3.8+0.9 cloud (from l = − 40 to − 3625, and from b = 05625 to 11875). The angular size considered for each region is listed in Table 2. The red lines indicate the Gaussian fit for the complete region and blue dashed lines show the Gaussian fits of each velocity components.
Current usage metrics show cumulative count of Article Views (full-text article views including HTML views, PDF and ePub downloads, according to the available data) and Abstracts Views on Vision4Press platform.
Data correspond to usage on the plateform after 2015. The current usage metrics is available 48-96 hours after online publication and is updated daily on week days.
Initial download of the metrics may take a while.