Fig. 8
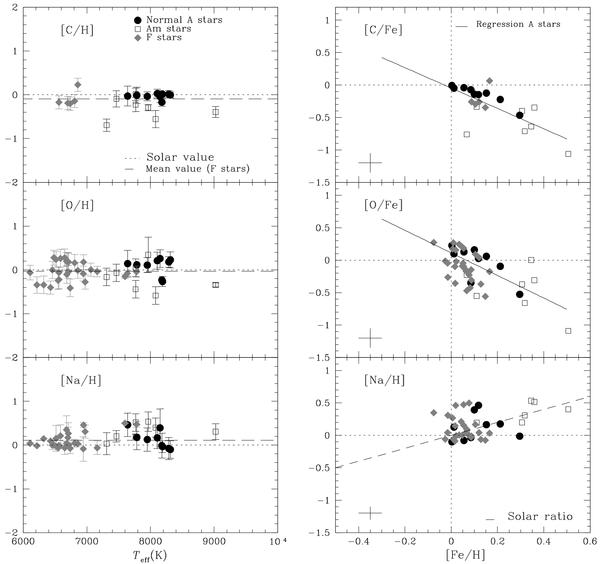
Left panel: abundances of C, O, and Na versus effective temperature. The dotted line corresponds to the solar value and the dashed line to the mean value determined for the F stars of the cluster. Right panel: [C/Fe], [O/Fe], and [Na/H] versus [Fe/H]. The filled dots correspond to normal A stars, the open squares correspond to Am stars, and the filled diamonds to F stars. In the plot representing [Na/H] versus [Fe/H], the dashed line corresponds to the solar [Na/Fe] ratio. The error bars in the right panel represent the mean standard deviation for the displayed abundances.
Current usage metrics show cumulative count of Article Views (full-text article views including HTML views, PDF and ePub downloads, according to the available data) and Abstracts Views on Vision4Press platform.
Data correspond to usage on the plateform after 2015. The current usage metrics is available 48-96 hours after online publication and is updated daily on week days.
Initial download of the metrics may take a while.