Free Access
Fig. 11
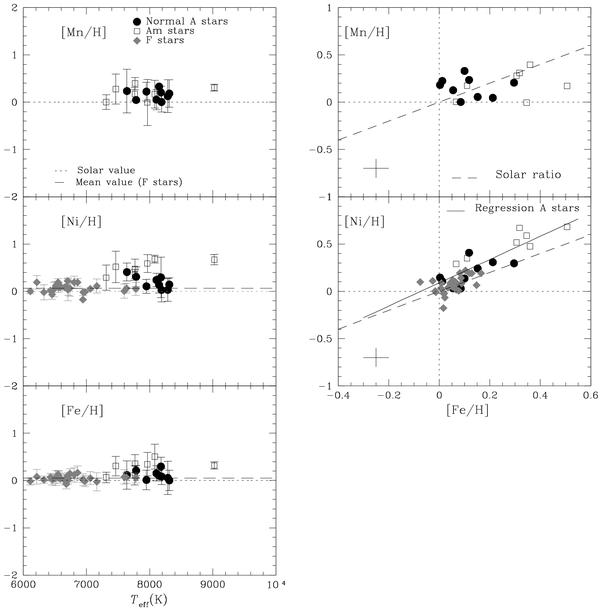
Left panel: abundances of Mn, Fe, and Ni versus effective temperature. The dotted line represents the solar value and the dashed one represents the mean abundance of F stars. Right panel: [Mn/H] and [Ni/H] versus [Fe/H]. The symbols are the same as in Fig. 8. The dashed lines represent the solar ratios.
Current usage metrics show cumulative count of Article Views (full-text article views including HTML views, PDF and ePub downloads, according to the available data) and Abstracts Views on Vision4Press platform.
Data correspond to usage on the plateform after 2015. The current usage metrics is available 48-96 hours after online publication and is updated daily on week days.
Initial download of the metrics may take a while.