Fig. 3
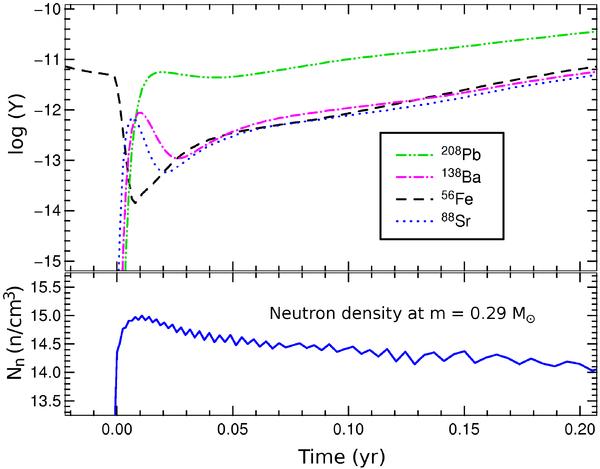
Evolution of the neutron density (lower panel, in logarithm) and of the abundances of selected heavy element species (upper panel, in logarithm) as a function of time during the main phase of the neutron superburst (t = 0 corresponds to the same time as in Figs. 1 and 2 and to the onset of the neutron flux). Abundances are sampled at 0.29 M⊙, the location of the maximum neutron density. All abundances, except those of protons and neutrons, are homogeneous within the HeCZ, and therefore their values in the plot are representative of the abundances in the whole region.
Current usage metrics show cumulative count of Article Views (full-text article views including HTML views, PDF and ePub downloads, according to the available data) and Abstracts Views on Vision4Press platform.
Data correspond to usage on the plateform after 2015. The current usage metrics is available 48-96 hours after online publication and is updated daily on week days.
Initial download of the metrics may take a while.