| Issue |
A&A
Volume 522, November 2010
|
|
|---|---|---|
| Article Number | A77 | |
| Number of page(s) | 5 | |
| Section | Galactic structure, stellar clusters and populations | |
| DOI | https://doi.org/10.1051/0004-6361/201015405 | |
| Published online | 04 November 2010 | |
Research Note
The connection between missing AGB stars and extended horizontal branches
1
INAF – Osservatorio Astronomico di Padova,
Vicolo dell’Osservatorio
5,
35122
Padova,
Italy
e-mail: raffaele.gratton@oapd.inaf.it, gratton@pd.astro.it
2
INAF – Osservatorio Astronomico di Bologna,
via Ranzani 1,
40127
Bologna,
Italy
3
Excellence Cluster Universe, Technische Universität München,
Boltzmannstr. 2,
85748
Garching,
Germany
Received: 16 July 2010
Accepted: 8 September 2010
Recent surveys confirm early results about a deficiency or even absence of CN-strong stars on the asymptotic giant branch (AGB) of globular clusters (GCs), although with quite large cluster-to-cluster variations. In general, this is at odds with the distribution of CN band strengths among first ascent red giant branch (RGB) stars. Norris et al. proposed that the lack of CN-strong stars in some clusters is a consequence of a smaller mass of these stars that cannot evolve through the full AGB phase. In this short paper we found that the relative frequency of AGB stars can change by a factor of two between different clusters. We also find a very good correlation between the minimum mass of stars along the horizontal branch (Gratton et al. 2010, A&A, 517, A81) and the relative frequency of AGB stars, with a further dependence on metallicity. We conclude that indeed the stars with the smallest mass on the HB cannot evolve through the full AGB phase, being AGB-manqué. These stars likely had large He and N content, and large O-depletion. We then argue that there should not be AGB stars with extreme O depletion, and few of them with a moderate one.
Key words: stars: abundances / stars: evolution / stars: Population II / globular clusters: general
© ESO, 2010
1. Introduction
Stars with very strong CN bands (CN-strong stars) are very common along the red giant branch (RGB) of globular clusters (GCs). It is then quite curious that most asymptotic giant branch (AGB) stars in GCs have weak CN bands, a fact first discovered by Norris et al. (1981) in the case of NGC 6752 (see also the review by Sneden et al. 2000). Similar results were obtained from Na and Mg abundances for a large sample of giants in M 13 by Pilachowski et al. (1996): stars with high [Na/Fe], dominating the upper RGB, do not seem to be represented among the AGB sample. Very recently, Campbell et al. (2010) reported initial results of a medium resolution survey of about 250 AGB stars over 9 GCs. These early results confirmed the lack of CN-strong AGB stars in NGC 6752, while in other GCs (like M 5: Smith & Norris 1993; and possibly like 47 Tuc: Mallia 1978; Campbell et al. 2006) a few CN-strong AGB stars are present, although they are less frequent than among RGB stars.
The low incidence of CN-strong stars along the AGB is striking, since the presence of strong CN bands is usually assumed to be evidence of more mixed material. However, a very interesting interpretation of this phenomenon was proposed by Norris et al. (1981). According to this hypothesis, “when star formation ceased in the cluster, there were two groups of stars having not only the observed carbon and nitrogen properties, but also a difference in helium abundance, ΔY ~ 0.05, in the sense that the nitrogen strong group has enhanced helium. This difference in helium leads to a mass difference of ~0.07 M⊙ at the main sequence turn-off, which, together with our current knowledge of horizontal branch morphology, provides an explanation of both the gap on the horizontal branch and the lack of CN-strong stars on the AGB. (The high helium, high CN group does not ascend the giant branch for a second time)”. This possible explanation was supported by models of HB stars (see e.g. Sweigart & Gross 1976; Greggio & Renzini 1990; Lee et al. 1994).
Thirty years later, we now know that multiple generations, differing in Na, O, and likely also He abundances, exist in virtually all GCs (Carretta et al. 2009a). In a separate paper (Gratton et al. 2010) we discussed the connection of the multiple generation scenarios with the morphology of the HB. Following the arguments made by Ventura et al. (2001), we interpret the extension of the horizontal branch (HB) to low masses observed in several GCs as the effect of enhanced He abundances (which combine with differences in ages and possibly other parameters to explain the so-called second parameter issue), exactly as proposed by Norris et al. (although with a different scenario for the formation of GCs: see Carretta et al. 2010).
Within this framework, we should then expect that there is a close relation between the extension of the HB (as represented e.g. by the minimum mass along the HB: see Gratton et al. 2010) and the frequency of AGB stars (as given by the ratio between the number of stars along the AGB and those on the RGB: see discussion in Sneden et al. 2000). While M13 indeed seems to have a low frequency of AGB stars (Caputo et al. 1978; Buzzoni et al. 1983), a comprehensive picture is missing. In this research note, we evaluate this correlation from current data (Sect. 2), and briefly discuss its implications (Sect. 3). Conclusions are drawn in Sect. 4.
2. The correlation between the minimum mass on the HB and the frequency of AGB stars
We evaluated the frequency of AGB stars in a number of GCs from the high quality photometric data sets considered by Gratton et al. (2010). These consist of two databases: the results of the HST snapshot survey by Piotto et al. (2002), and the ground-based survey of GCs by Rosenberg et al. (2000a,b). With respect to the analysis of HB stars presented in Gratton et al. (2010) we have two additional problems.
First, AGB stars are an order of magnitude less numerous than RGB and HB stars. Hence, only those GCs with large populations of RGB stars have a numerous enough population of AGB stars. In practice, for HST data we limited ourselves only to those GCs that have > 100 RGB stars, where the definition of RGB stars is here those stars more luminous than V(HB) + 1 (see Gratton et al. 2010). For the ground-based data (where contamination by field stars is larger) we used an even more restrictive criterion of > 200 RGB stars. The values of the magnitude of the HB V(HB) were taken from Harris (1996).
Second, separation of AGB stars from RGB stars is very difficult in those clusters where there is significant differential reddening. This is usually the case for highly reddened clusters. Hence, we limited ourselves to those GCs having a reddening E(B − V) ≤ 0.25.
The total of GCs satisfying these two criteria is 26, covering a wide range in metallicity and extension of the HB. Low luminosity clusters are however absent from our sample, simply because they do not have enough stars.
In each GC, we first subtracted the field stars, following the same procedure described in Gratton et al. (2010). Then we separated AGB stars from those on the HB assuming that only stars with V < V(HB) − 0.5 could be on the AGB, and then separated AGB stars from RGB stars by their colours being bluer than a dividing straight line, whose inclination is a function of metallicity, and horizontal position was guided by eye. Stars much bluer (more than 0.3 mag) than this dividing line were assumed to be field object, not properly subtracted by our procedure. We acknowledge that this procedure neglects a few bright AGB stars – which are anyway very difficult to be separated from the brightest RGB stars. However, there are very few such stars in each GCs, so that the impact of this error in our discussion is very small (actually, much smaller than our error bars). On the other hand, uncertainties in the separation of AGB and RGB stars contribute to the errors. In the case of HST photometry, which is more accurate, on average we change our estimates of the ratio between the number of AGB and RGB stars by ±0.011 if we shift the colour of the separating line by ±0.02 mag. Since ground-based data are less accurate, we expect larger errors. Figure 1 illustrates a couple of examples of application of this procedure.
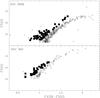 |
Fig. 1 Separation of AGB stars (filled squares) and other stars (small empty squares) in the HST colour magnitude diagrams of NGC 2808 (upper panel) and NGC 362 (lower panel). |
Table 1 gives the list of the GCs, their metallicity from Carretta et al. (2009b); the absolute magnitude MV and the reddening E(B − V) from Harris (1996); the minimum mass along the HB Mmin and the number of RGB stars n(RGB) from Gratton et al. (2010); the number of AGB stars n(AGB), and the ratio fAGB between the number of AGB and RGB stars, with the error given by Poisson statistics. For NGC 2419, we adopted a value of Mmin = 0.51 M⊙, which is consistent with its extreme BHB (Ripepi et al. 2007), below the limiting magnitude of the Piotto et al. (2002) photometry.
Counts of AGB stars.
Figure 2 displays the run of fAGB with Mmin for both HST and ground-based data. As expected, in both cases there is a clear correlation between these two quantities. Considering only the HST data, the linear correlation coefficient is r = 0.75 (22 GCs), which is significant at a very high level of confidence. GCs with extended blue HBs (like NGC 2808) have roughly half the relative frequency of AGB stars of those with short HBs. This confirms the earliest finding for M 13 by Caputo et al. (1978) and Buzzoni et al. (1983), which is now shown to be a general property. The correlation seems to break at large values of Mmin. This might be due to a combination of two effects: first, in our approach we neglected the most luminous AGB stars, a phase that can be reached only by the evolution of the most massive HB stars in GCs; and second, the lifetime on the AGB of the most massive stars in GCs might be only weakly dependent on the mass of the star on the HB, perhaps because the mass loss rate is very large for the most luminous stars.
As noticed by the referee, while the correlation is indeed good, there seems to be a significant spread in fAGB values at a given Mmin. This spread is correlated with cluster metallicity (see Fig. 2): in fact, the correlation between [Fe/H] values and residuals around the best fit line is r = 0.52 (22 GCs), which is significant at better than 1%.
The correlation between the frequency of AGB stars and metallicity should not come as a surprise. In fact, Frogel & Elias (1988) found that the maximum luminosity of stars along the AGB is a function of metallicity (see their Fig. 1). This agrees with a scenario where the evolution of small mass stars along the AGB is limited by the first thermal pulse, which occurs at lower luminosities (and masses) for metal-poor stars (Renzini & Fusi Pecci 1988). However, the correlation with metallicity is fairly independent from that on Mmin, which is stronger. This correlation merits then a separate discussion.
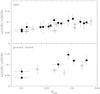 |
Fig. 2 Run of the fAGB = n(AGB)/n(RGB) ratio with the minimum mass along the HB Mmin (see Gratton et al. 2010) for both HST (upper panel) and ground-based data (lower panel). Filled squares are for GCs with [Fe/H] > −1.7, open squares for GCs with [Fe/H] < −1.7. |
3. Discussion
We first notice that the ratio fAGB ~ 0.1 we obtain for those GCs rich in AGB stars agrees with expectations based on lifetimes of the corresponding evolutionary phases. These are 14 Myr for a 0.6 M⊙ AGB stars, and 140 Myr for the time required for a moderately metal-poor (Z = 10-3) star of 0.8 M⊙ to climb the RGB from 1 magnitude below the HB level, up to the tip of the RGB (see Bertelli et al. 2009). On the other hand, the obvious interpretation of the correlation between n(AGB)/n(RGB) and Mmin is that small mass HB stars either do not reach the AGB, or leave it much earlier than the more massive ones.
To give further insight into this issue, we consider the following rough argument. Using the core mass-luminosity relation (Paczynski 1971; Marigo 2000) and stellar models (Bertelli 2009), we can estimate that the core mass of a GC star when it reaches the AGB is about 0.49 M⊙, and it is about 0.50 M⊙ when it reaches the luminosity similar to that of the tip of the RGB (about log L/L⊙ ~ 3), which is roughly the maximum observed luminosity for stars in GCs (actually, this luminosity depends on metallicity; see previous section). According to models, the mass of the envelope of a 0.6 M⊙ AGB stars with a luminosity of log L/L⊙ ~ 3 is ~0.05 M⊙. Let us then assume that a star leaves the AGB when the mass of the envelope is that large1. Hence an HB star with a mass < 0.54 M⊙ will not even start the AGB. The same models indicate that a star of 0.8 M⊙ and Z = 10-3 takes about 29 Myr to climb the RGB from the luminosity of the base of the AGB up to the tip of the RGB, while a 0.6 M⊙ AGB star takes about 14 Myr to run the corresponding track along the AGB. According to Gratton et al. (2010), a typical RGB star loses some 0.2 M⊙ before reaching the HB (see also Renzini & Fusi Pecci 1988); most of this loss is in the late phases of the RGB. Assuming that RGB and AGB stars have a similar mass loss rate, we may then expect that a GC star may lose some 0.1 M⊙ while climbing the AGB. Then, the minimum HB mass required to reach the tip of the AGB is about 0.65 M⊙, which is indeed the typical mass of HB stars (see Fig. 10 of Gratton et al. 2010). (This is actually a sanity check, showing that our reasoning is consistent with the data we have). According to this picture, small mass HB stars (M < 0.54 M⊙) do not begin the AGB. These objects are the AGB-manqué stars (Greggio & Renzini 1990); they have been found in several clusters (see e.g. the case of NGC 2808: Castellani et al. 2006). The others leave the AGB at different luminosities, and only those with masses M > 0.65 M⊙ may get as luminous as the tip of the RGB. We could then expect that the frequency of AGB stars depends on the distribution of masses along the HB.
We note that if the mass of an RGB star is smaller than that required for the He-core flash (about 0.50 M⊙: Castellani & Castellani 1993), the star will leave the RGB before reaching its tip. Such stars, usually called RGB-manqué, will become He-white dwarfs; however, they will likely have a late He-flash, after which they will move to the blue hook of the HB, and later once for all to the C–O white dwarf cooling sequence, without becoming an AGB star (Castellani & Castellani 1993; D’Cruz et al. 2000; Brown et al. 2000; Moehler et al. 2004). These small mass RGB stars might either be in mass transfer binaries, or normal single stars with a suitable combination of helium abundance, age, and metal abundance. For instance, using data and equations considered in Gratton et al. (2010), single stars in NGC 2808 (or in M 13) with roughly Y > 0.35 (Y > 0.335) should be RGB-manqué, those with 0.33 < Y < 0.35 (0.31 < Y < 0.335) should become AGB-manqué, while those with Y < 0.33 (Y < 0.31) might successfully start their evolution along the AGB. Only those AGB stars with Y ~ 0.25 will reach a luminosity similar to the tip of the RGB. However, most of the mass loss by RGB stars occurs just in the latest phases of the RGB. Castellani & Castellani (1993), considered the Reimers (1975) mass loss law with different values of the efficiency parameter η. The values of η they considered were quite large. The smallest ones, with η = 0.5 yields an average mass loss of 0.2 M⊙ along the RGB of a metal-poor GC like M 15, somewhat larger than required to explain its HB (Gratton et al. 2010). In such a model, half of the mass is lost in the last 0.4 Myr, that is < 1% of the time spent at luminosities brighter than MV(HB) + 1, while the star is climbing the last 0.7 mag (in bolometric magnitude) on the RGB. Other mass loss laws give an even stronger dependence on luminosity (see the discussion in Catelan 2009), and hence concentration of the mass loss in the later phases of the RGB. As a consequence, even the most He-rich stars are expected to make most of the evolution along the RGB. While there should be a deficiency of He-rich stars very close to the tip of the RGB, it will be very difficult to establish this effect due to the small numbers involved. As a consequence, we should not expect any significant effect on the number counts on the RGB, while of course there are large consequences on the later evolutionary phases.
We may better evaluate the impact of our result by considering two GCs with similar metallicity, but very different HB morphology. A similar pair may be provided by NGC 362 and NGC 2808. The first cluster has a quite short HB, with a minimum mass of 0.60 M⊙, and a median one of 0.68 M⊙. In such a cluster, most stars will climb up through the whole AGB, and should then have a large value of fAGB. Indeed we get fAGB = 0.115 ± 0.019, among the highest we found. We then expect that the distribution of stars along the Na–O and other anti-correlations to be similar for AGB and RGB stars (a prediction that could be tested with appropriate observations). On the other hand, in the case of NGC 2808 the distribution of stars along the HB is trimodal: about 20% of the stars are extreme BHB stars, with masses well below the minimum of 0.54 M⊙ required to start evolution along the AGB; about 40% of the stars are quite massive (~0.68 M⊙), and similarly to the bulk of the stars of NGC 362 they may evolve through the AGB up to a luminosity similar to that of the tip of the RGB; finally, another 40% of the stars have a mass of about 0.61 M⊙, which should allow them to start their evolution along the AGB, which is however terminated before reaching the luminosity of the tip of the RGB. Assuming that these stars are able to be on the AGB half the time of the more massive ones, we may expect that NGC 2808 has a value of fAGB which is about 60% that of NGC 362. The value we obtain is actually a bit lower, about 50 ± 11% using HST data, and even lower using the ground-based data. This suggests that the progeny of HB stars of intermediate mass of NGC 2808 are able to remain on the AGB for less than half of the typical lifetime of AGB stars. In this case, we then expect that the distribution of AGB stars along the various anti-correlations (C–N, Na–O, Mg–Al) be very different from that found for RGB stars, because we expect that extreme BHB stars are connected with the extremely O-depleted stars, the BHB stars with the moderately O-poor, and the RHB with the O-rich stars. If this picture is correct, we predict that there should be no extremely O-depleted stars, about a third or less of moderately O-depleted, and a vast majority of O-rich stars along the AGB of NGC 2808.
4. Conclusions
We derived the relative frequency of AGB stars, given by the ratio of stars counted on the AGB and RGB, in 26 GCs. The clusters were selected to have extensive and uniform high quality data and small reddening. We found a good correlation between the ratio of AGB to RGB stars fAGB = n(AGB)/n(RGB) and the minimum mass of stars along the HB Mmin, with a further dependence on metallicity. This agrees with the expectation that the less massive HB stars (M < 0.54 M⊙) do not even begin their AGB phase. For the remaining HB stars, the extension of the AGB lifetime is a function of their mass and metallicity.
Since the mass of the HB stars is expected to be correlated with their chemical composition (see Gratton et al. 2010), we then expect that most He-rich (Na-rich and O-poor) stars in GCs do not reach the AGB. He-poor (Na-poor, O-rich) stars may have an extended evolution on the AGB, up to the luminosity of the tip of the RGB. The stars having an intermediate composition begin their AGB, but terminate their AGB evolution before reaching such bright luminosities.
As first suggested by Norris et al. (1981), this explains well the distribution of AGB stars along the C–N anticorrelation, which is clearly different from that observed for RGB stars (see also Campbell et al. 2010).
The criterion considered by Renzini & Fusi Pecci (1988) is slightly different, being 0.04 M⊙ the mass between the two burning shells.
Acknowledgments
This research has been funded by PRIN MIUR 20075TP5K9.
References
- Bertelli, G., Nasi, E., Girardi, L., & Marigo, P. 2009, A&A, 508, 355 [NASA ADS] [CrossRef] [EDP Sciences] [Google Scholar]
- Brown, T. M., Sweigart, A. V., Lanz, T., et al. 2000, ApJ, 562, 368 [Google Scholar]
- Buzzoni, A., Fusi Pecci, F., Buonanno, R., & Corsi, C. E. 1983, A&A, 128, 94 [NASA ADS] [Google Scholar]
- Campbell, S. W., Lattanzio, J. C., & Elliott, L. M. 2006, MSAIt, 77, 864 [Google Scholar]
- Campbell, S. W., Yong, D., Wylie-de Boer, E. C., et al. 2010 in Proc. 10th Torino Workshop on Asymptotic Giant Branch Nucleosynthesis: From Rutherford to Beatrice Tinsley and Beyond, ed. C. C. Worley, C. A. Tout, & R. J. Stancliffe [Google Scholar]
- Caputo, F., Castellani, V., & Wood, P. R. 1978, MNRAS, 184, 377 [NASA ADS] [Google Scholar]
- Carretta, E., Bragaglia, A., Gratton, R. G., et al. 2009a, A&A, 505, 117 [NASA ADS] [CrossRef] [EDP Sciences] [Google Scholar]
- Carretta, E., Bragaglia, A., Gratton, R. G., et al. 2009b, A&A, 508. 695 [NASA ADS] [CrossRef] [EDP Sciences] [Google Scholar]
- Carretta, E., Bragaglia, A., Gratton, R. G., et al. 2010, A&A, 516, A55 [NASA ADS] [CrossRef] [EDP Sciences] [Google Scholar]
- Castellani, M., & Castellani, V. 1993, ApJ, 407, 649 [NASA ADS] [CrossRef] [Google Scholar]
- Castellani, V., Iannicola, G., Bono, G., et al. 2006, A&A, 446, 569 [NASA ADS] [CrossRef] [EDP Sciences] [Google Scholar]
- Catelan, M. 2009, in Resolved Stellar Populations, ed. D. Valls-Gabaud, & M. Chavez, Ap&SS, ASP Conf. Ser., 320, 261 [Google Scholar]
- D’Cruz, N. L., O’ Connell, R. W., Wood, R. T., et al. 2000, ApJ, 530, 352 [NASA ADS] [CrossRef] [Google Scholar]
- Frogel, J. A., & Elias, J. H. 1988, ApJ, 324, 823 [NASA ADS] [CrossRef] [Google Scholar]
- Gratton, R., Carretta, E., Bragaglia, E., et al. 2010, A&A, 517, A81 [NASA ADS] [CrossRef] [EDP Sciences] [Google Scholar]
- Greggio, L., & Renzini, A. 1990, ApJ, 364, 35 [Google Scholar]
- Harris, W. E. 1996, AJ, 112, 1487 [NASA ADS] [CrossRef] [Google Scholar]
- Lee, Y.-W., Demarque, P., & Zinn, R. 1994, ApJ, 217, L101 [Google Scholar]
- Mallia, E. A. 1978, A&A, 70, 115 [NASA ADS] [Google Scholar]
- Marigo, P. 2000, A&A, 360, 617 [NASA ADS] [Google Scholar]
- Moehler, S., Sweigart, A. V., Landsman, W. B., et al. 2004, A&A, 415, 313 [NASA ADS] [CrossRef] [EDP Sciences] [Google Scholar]
- Norris, J., Cottrell, P. L., Freeman, K. C., & Da Costa, G. S. 1981, ApJ, 244, 205 [NASA ADS] [CrossRef] [Google Scholar]
- Paczynski, B. 1971, Acta Astron. 21, 1 [NASA ADS] [Google Scholar]
- Pilachowski, C. A., Sneden, C., Kraft, R. P., & Langer, G. E. 1996, AJ, 112, 545 [NASA ADS] [CrossRef] [Google Scholar]
- Piotto, G., King, I. R., Djorgowski, S. G., et al. 2002, A&A, 391, 945 [NASA ADS] [CrossRef] [EDP Sciences] [Google Scholar]
- Reimers, D. 1975, Mem. Soc. R. Sci. Liège, 6, 8, 369 [Google Scholar]
- Renzini, A., & Fusi Pecci, F. 1988, ARA&A, 26, 199 [NASA ADS] [CrossRef] [Google Scholar]
- Ripepi, V., Clementini, G., Di Criscienzo, M., et al. 2007, ApJ, 667, L61 [NASA ADS] [CrossRef] [Google Scholar]
- Rosenberg, A., Piotto, G., Saviane, I., & Aparicio, A. 2000a, A&AS, 144, 5 [NASA ADS] [CrossRef] [EDP Sciences] [Google Scholar]
- Rosenberg, A., Aparicio, A., Saviane, I., & Piotto, G. 2000b, A&AS, 145, 451 [NASA ADS] [CrossRef] [EDP Sciences] [Google Scholar]
- Smith, G. H., & Norris, J. E. 1993, AJ, 105, 173 [NASA ADS] [CrossRef] [Google Scholar]
- Sneden, C., Ivans, I., & Kraft, R. P. 2000, MSAIt, 71, 657 [Google Scholar]
- Sweigart, A. V., & Gross, P. G. 1976, ApJS, 32, 367 [NASA ADS] [CrossRef] [Google Scholar]
- Ventura, P., D’ Antona, F., Mazzitelli, I., & Gratton, R. 2001, ApJ, 550, L65 [NASA ADS] [CrossRef] [Google Scholar]
All Tables
All Figures
|
Fig. 1 Separation of AGB stars (filled squares) and other stars (small empty squares) in the HST colour magnitude diagrams of NGC 2808 (upper panel) and NGC 362 (lower panel). |
| In the text | |
|
Fig. 2 Run of the fAGB = n(AGB)/n(RGB) ratio with the minimum mass along the HB Mmin (see Gratton et al. 2010) for both HST (upper panel) and ground-based data (lower panel). Filled squares are for GCs with [Fe/H] > −1.7, open squares for GCs with [Fe/H] < −1.7. |
| In the text | |
Current usage metrics show cumulative count of Article Views (full-text article views including HTML views, PDF and ePub downloads, according to the available data) and Abstracts Views on Vision4Press platform.
Data correspond to usage on the plateform after 2015. The current usage metrics is available 48-96 hours after online publication and is updated daily on week days.
Initial download of the metrics may take a while.