| Issue |
A&A
Volume 522, November 2010
|
|
|---|---|---|
| Article Number | A65 | |
| Number of page(s) | 9 | |
| Section | Catalogs and data | |
| DOI | https://doi.org/10.1051/0004-6361/201015325 | |
| Published online | 04 November 2010 | |
New high-sensitivity, milliarcsecond resolution results from routine observations of lunar occultations at the ESO VLT *
1
European Southern Observatory,
Karl-Schwarzschild-Str. 2,
85748
Garching bei München,
Germany
e-mail: arichich@eso.org
2
Departament Astronomia i Meteorologia and Institut de Ciències del
Cosmos (ICC), Universitat de Barcelona (UB/IEEC), Martí i Franqués 1, 08028
Barcelona,
Spain
3
Observatori Fabra, Camí de l’Observatori s/n,
08035
Barcelona,
Spain
4
Graduate Institute of Astronomy, National Central University,
300 Jhongda Road,
Jhongli
32054,
Taiwan
5
European Southern Observatory, Santiago, Chile
Received:
2
July
2010
Accepted:
14
July
2010
Context. Lunar occultations (LO) are a very efficient and powerful technique that achieves the best combination of high angular resolution and sensitivity possible today at near-infrared wavelengths. Given that the events are fixed in time, that the sources are occulted randomly, and that the telescope use is minimal, the technique is very well suited for service mode observations.
Aims. We have established a program of routine LO observations at the VLT observatory, especially designed to take advantage of short breaks available in-between other programs. We have used the ISAAC instrument in burst mode, capable of producing continuous read-outs at millisecond rates on a suitable subwindow. Given the random nature of the source selection, our aim has been primarily the investigation of a large number of stellar sources at the highest angular resolution in order to detect new binaries. Serendipitous results such as resolved sources and detection of circumstellar components were also anticipated.
Methods. We have recorded the signal from background stars for a few seconds, around the predicted time of occultation by the Moon’s dark limb. At millisecond time resolution, a characteristic diffraction pattern can be observed. Patterns for two or more sources superimpose linearly, and this property is used for the detection of binary stars. The detailed analysis of the diffraction fringes can be used to measure specific properties such as the stellar angular size and the presence of extended light sources such as a circumstellar shell.
Results. We present a list of 191 stars for which LO data could be recorded and analyzed. Results include the detection of 16 binary and 2 triple stars, all but one of which were previously unknown. The projected angular separations are as small as 4 milliarcsec and magnitude differences as high as ΔK = 5.8 mag. Additionally we derive accurate angular diameters for 2 stars and resolve circumstellar emission around another one, also all for the first time. We have established upper limits on the angular size of 177 stars, mostly in the 1 to 5 mas range, and we plan to include them in a future list of sources well suited for the calibration of interferometers.
Conclusions. We confirm the performance of the technique already
established in our previous work. LO at an 8 m-class telescope can achieve an angular
resolution close to
 with a sensitivity
K ≈12 mag.
with a sensitivity
K ≈12 mag.
Key words: techniques: high angular resolution / occultations / binaries: general / stars: fundamental parameters / circumstellar matter / infrared: stars
© ESO, 2010
1. Introduction
Lunar occultations (LO) are a simple and effective technique to achieve high angular resolution far exceeding the diffraction limit of any single telescope, and matched only by long-baseline interferometry (LBI) which however has much more demanding technical requirements. In a LO event, the light of a background source occulted by the Moon falls to zero with a characteristic diffraction pattern. For a simple monochromatic point-source, the pattern is determined by the wavelength and by the distance to the Moon. As the Moon moves over the source, the pattern sweeps over a ground-based telescope with a speed which is typically of order ≈0.75 m/ms, but which can be significanly slower in case of events occurring with high contact angles. The practical case of a resolved stellar disc observed in a broad-band filter can be easily modelled by the convolution of several point-like monochromatic patterns. Likewise, smearing due to the telescope aperture and to the finite detection time can also be modelled. In the case of sources exceeding some characteristic angular size, about 20 to 40 milliarcsec (mas) at near-infrared wavelengths, the diffraction fringes are completely smeared and the monotonic intensity fall intuitively expected for geometrical optics is observed.
From these few considerations it is apparent that LO can be used to measure stellar angular diameters. Moreover, the diffraction patterns of two or more sources add linearly, so LO can easily detect binary and multiple stars. These two applications have provided the bulk of LO results, starting from the first photoelectic and infrared observations a few decades ago. The CHARM2 catalog (Richichi et al. 2005) lists several hundreds of LO results both for angular diameters and for binary stars.
A severe limitation of LO is of course the fact that the sources are randomly selected in a restricted area of the sky (≈10%), and that they are fixed-time events. As LBI progressed both in performance and in reliability, in the past decade LO have gradually lost their competitive edge. However, two important factors are tipping the scale again in their favor: the availability of sensitive infrared all-sky surveys, and the increase in limiting magnitude provided by the use of very large telescopes. In two previous papers (Richichi et al. 2008a,b, Papers I and II hereafter) we have described the first results from this renaissance in the LO technique, applied to very crowded regions in the vicinity of the Galactic Center. The present paper follows closely in the footsteps, and for this reason we do not repeat here several of the technical details already provided in Paper I. An important point however is the fact that now LO have been implemented as a routine service program at the ESO VLT. Here we present the results from the first periods of service mode observation.
List of the recorded occultation events.
2. Observations and data reduction
As before, we have used the burst mode available at the ISAAC instrument. We have taken advantage of the fact that this mode is now publicly offered and supported at ESO, and we have proposed to observe LO as a filler between other programs. In particular, given that LO can be satisfactorily observed also under less than optimal sky conditions and that each event requires only a relatively short telescope time, we have aimed at filling gaps in which other service programs could not be executed either because of weather or because of the available slots being too short.
In each of three six-month periods starting in October 2007, April 2008, and April 2009 (ESO P80, P81, P83 respectively) we have been granted 15 h of observing time. In each period we have submitted so-called observing blocks (OB, i.e. templates for the automated telescope and instrument operation) for about 1000 LO events. This sufficed to provide one event for any 5 min interval when the Moon was above the elevation limits, when service mode was available, and with the correct phase – LO cannot be observed on the bright side of the limb and we restricted ourselves to disappearances for service mode. Our predictions were based on the 2MASS Catalog (Cutri et al. 2003), with a limiting magnitude set to K = 11, which is above our nominal detection limit but already provides significantly more events than can be practically observed. Sources were then prioritized by their brightness and colors, and when available on the basis of cross-identifications, auxiliary data and literature entries in the Simbad database.
Summary of results: binaries and triples.
Summary of results: angular sizes.
For all three periods, the integration time was 3.2 ms. In the burst mode, this represents also the effective sampling time, i.e. there are no dead times. Also the frame size was always the same, namely 32 × 32 pixels corresponding to about  on the sky. A broad-band Ks filter was always used, except for the very bright source 2MASS 10093146+0935352 when we used a narrow band filter centered at 2.07 μm. The transmission curve of these two filters in the cold was properly accounted for in our data reduction. Out of the total of 220 events, only 191 have useful data and they are listed in Table 1. The remaining events were affected by various problems, the more frequent ones being mispointing of the telescope or data recording started too late or too early.
Details about the generation of the light curves from the data cubes and about the data reduction were given in Paper I. Here we only briefly state that the bulk of the raw data processing has been done via a specific pipeline (Fors et al. 2008) that performs automatic mask generation, data extraction, and wavelet-transform analysis to derive first guesses of the main free parameters in the fits. A more detailed interactive analysis was then carried out on a selected number of sources using both model-dependent and model-independent procedures (ALOR and CAL respectively, Richichi et al. 1996; and Richichi 1989). We also used the approach described in Richichi et al. (1996) to compute upper limits on the angular sizes of the unresolved sources. As already derived in Papers I − II, the LO technique at VLT/ISAAC effectively reaches ≈1 mas in angular resolution and K ≈ 12 mag in sensitivity, thus representing the most powerful combination presently available for high angular resolution in the near-IR.
3. Results
A list of the sources observed, including details of observation and comments, is provided in Table 1. They are distributed over about half of the total length of the ecliptic. There is no overlap with the sources included in Papers I–II. While the majority of the targets have near-IR colors consistent with those of giant or dwarf stars, in several cases more extreme colors are also observed. Although the closest distance to the Galactic Center is about 7°, a significant part of the sample is located in the general direction to the galactic bulge and in some cases reddening may have been significant. However also a few individual cases of marked extinction probably of local origin have been noticed, as discussed below.
About one-third of the sources have some cross-identification in the Simbad database, and less than one-sixth have a spectral determination. Even for these, the literature entries are mostly very scarce.
In Tables 2, 3 we list the sources for which we found a positive result, either as binary or triple stars or with a resolved angular diameter. Unlike Table 1 which is ordered by date and time of occultation, Tables 2, 3 are ordered by right ascension for ease of reference. They follow the same format of Paper I and of previous papers referenced therein. In summary, the columns list the value of the fitted linear rate of the event V, its deviation from the predicted rate Vt, the local lunar limb slope ψ, the position and contact angles, and the signal-to-noise ratio (SNR). In Table 2, the projected separation and the brightness ratio are given, and in addition also the individual magnitudes obtained by decomposition of the 2MASS magnitude. In Table 3, the the angular diameter φUD is reported for resolved stars, under the assumption of a uniform stellar disc, or the characteristic size of the shell. All angular quantities are computed from the fitted rate of the event.
In the following of this section we focus mainly on the sources which were found to be resolved and for which we can provide some context from existing literature. We then discuss briefly those without any known cross-identification. Without showing figures of all the data and their fits, we present as illustration only an example of a resolved diameter and of a binary source. As in Papers I and II, we provide at the end some quantitative evaluations derived from the large body of the unresolved sources.
3.1. Resolved sources with known cross-identifications
08202097+2044517: this object coincides with HR 3264 = SAO 80112, a bright K1 III star with numerous bibliographical entries, notably about its radial velocity and rotation. The former does not seem to vary noticeably, and the latter is very slow (Famaey et al. 2005; de Medeiros & Mayor 1995). This star has well determined photometry from the visual to the mid-infrared. Gondoin (1999) estimated Teff = 4600 K, and a mass of 2.7 M⊙. The observed (B−V) = 1.14 mag suggests very little visual extinction. The angular diameter has been estimated at 1.12 ± 0.02 mas (Mérand et al. 2005) but we could not resolve it in our observation. However, we detect for the first time a very faint companion, with projected separation of 22.6 mas. Assuming a total magnitude of 3.13 from 2MASS (which however had to include a saturation correction) we derive a magnitude K = 8.9 for the companion. Follow-up by long-baseline interferometry is very challenging due to the magnitude difference, but AO imaging at a large telescope might detect the companion. The use of this star as an interferometric calibrator as proposed by Mérand et al. (2005) should be considered with care.
10093146+0935352: this star is HD 88071, which has several photometric determinations from the visual to the near-IR. It is relatively nearby (Hipparcos parallax 3.50 ± 0.85 mas) and if one assumes negligible extinction the colors point to mid-M giant or M0 supergiant, consistent with the available spectral type. It seems to have a variable radial velocity, e.g., Rv = 8.06 +/− 0.30 (Famaey et al. 2005), and Rv = 6.1 (Wilson & Joy 1950), suggestive of binarity. We have discovered for the first time a companion, with projected separation of just 5.6 mas and 3.8 mag fainter than the primary in the K band. Using the nominal Hipparcos distance and our separation, the companion appears to be at 1.6 AU from the primary. In the absence of precise notions on the spectral class of the primary and due to uncertainties on the eccentricity, and on the actual radial velocity spread and not least to projection effects, any consistency check between the observed Rv differences and the separation has to be postponed. We note that the companion is probably beyond the reach of the largest AO-assisted telescopes, and very challenging also for long-baseline interferometers.
10331964+0621594: this is the G0 star HD 91411. The visual and near-IR spectral energy distribution and colors are consistent with a G dwarf. Its parallax yields a distance of 143 pc. There is no literature reference listed in Simbad. Our occultation observation revealed a triple system, with short projected separations A−B and A−C of 4.1 and 8.4 mas respectively. From the total 2MASS magnitude, we derive K = 8.07, K = 9.51 and K = 10.38 mag for the three components. Also this system might be challenging to follow-up by other techniques.
14461088-2110332: this well-studied bright star (V = 6.4 mag, 17 Lib, HR 5504, Fin 309 ) has an extensive list of measurements and publications which we summarize here only briefly. Its spectral type is generally recognized as G2V making it a solar analog, although F7V was also reported by Piters et al. (1998). The distance is 42 pc, and precise parallax and proper motion measurements suggest membership in the young-middle age thin disk population (Bartkevicius & Gudas 2001), also evidenced in its moderately rich metallicity ([Fe/H ] = +0.11, Eggen 1998).
The star is a known binary system with almost equal optical brightness components and a 26 y period. Extensive visual and speckle measurements are listed in the Fourth Interferometric Catalog (Hartkopf et al. 2010, 4IC hereafter) and, in spite of the orbit being relatively eccentric e = 0.64 and not yet completely observed, orbital elements are available. Our LO observation easily resolved the pair, and in fact the separation between the two stars (423 ms, or 265 m projected at the lunar limb) was large enough that the fringe patterns of the two components had to be fitted with slightly different limb rate values, with a difference of 2° in the local limb slope at the points of contact of the two stars. Using the average result of the two fits, we derive the angular separation listed in Table 2, which is in agreement with the orbital elements provided in the 4IC (predicted projected separation 149 mas) when the scatter of the measurements is included and also considering that other measurements close to our epoch seem to indicate a smaller-than-predicted separation. Our flux ratio is very accurately determined, R = 1.0203 ± 0.0003 at K band, and will also help to disentangle the assignments of the quadrants in speckle observations which are challenging in the presence of equal brightness components. The fact that the companion has about the same brightness as the primary in both the optical and infrared wavelengths shows that this system consists of almost twins.
17095865-2549195: this object was noted by Terzan & Ounnas (1988, Terz V720) as a variable star in the Sgr B cloud, based on BVR plates of Palomar Observatory with R brightness varying between 15.9 and 18 mag in a few months. It has extreme near-infrared colors, with J = 9.02, H = 7.64, and K = 6.69 mag. Our lunar occultation observations revealed a companion with projected separation of just 6.6 mas, 3.4 mag fainter. It is not clear whether the fainter star in our K band is the primary or the secondary in the visual, i.e. whether one of the two stars has much redder colors. We also note that our observation barely detects a possible fainter companion at 60 mas, but this is at the limit of the noise and we mention it only in case of findings by future investigations. Follow-up observations of this object are warranted.
17151916-2730178: we could record a high SNR light curve for this star, which yielded a resolved angular diameter of 3.02 ± 0.04 mas (see Fig. 1). No literature reference and no spectral type for this star were found in the Simbad database, but it coincides with CD-27 11537 having V = 9.6 mag. It is however very bright in the near-IR with K = 3.69 mag. The 2MASS colors (J − H = 1.28, H − K = 0.39 mag) suggest a highly reddened giant star. In the absence of a spectral type we assume an early M giant, which would have a diameter ≈100 R⊙ and absolute K ≈ −4. Neglecting extinction, it should thus be at a distance of 340 pc, thereby subtending an angular diameter approximately consistent with our measurement.
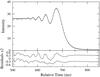 |
Fig. 1 Top panel: data (dots) and best fit (solid line) for 17151916-2730178. The lower panel shows, on an enlarged scale and displaced by arbitrary offsets for clarity, the residuals of the fits by a point-like (above, reduced χ2 = 2.2) and a resolved uniform-disk model (below, reduced χ2 = 1.0) as listed in Table 3. |
 along PA = 221° in 1927 (Dommanget & Nys 2002), and
  along PA = 218° at epoch 1985.36 (Heintz 1987). Photometric information includes V = 9.9 and 11.3 mag for the primary and secondary components, respectively. This star also coincides with TYC 6866-75-1, whose Tycho magnitudes can be converted to obtain V = 10.15 mag which however does not seem in complete agreement with either the sum of the previously quoted values or with just the primary. The difference could be due to the mixed use of visual and photoelectric magnitude systems. Our observation reveals a close pair with a projected separation of 37.5 mas along PA = 27°, and a total flux consistent with the 2MASS K = 6.2 mag. The companion is clearly a third (hierarchical) component in the system, since the AB projected separation should have been about 40 times larger. However, the issue of whether this is a companion to ADS 11463 A or B is not completely clear. We should have seen both A and B in our field of view and in the range of our light curve, but we do not detect a second pattern to the limit K ≳ 10 mag. In the absence of near-IR photometry, the best guess is that ADS 11463 A is a late-type giant star (V − K ≈ 3.5 mag) with the close companion detected by us, while B is a main sequence star with V − K ≲ 1.5 mag.
19291020-2357229: this star coincides with CD-24 15361 and TYC 6876-970-1, which have no bibliographical entries. We have detected for the first time a companion with 9.4 mas projected separation. The K magnitudes of 7.2 and 9.8 for the two components put follow-up observations at the limit of the capability of a large long-baseline interferometers such as the ESO VLTI.
19310667-2410011: we resolved for the first time this source as binary, with 14.9 mas projected separation and K magnitudes of 4.6 and 8.7 for the two components. This star coincides with IRAS 19280-2416 for which only the 12 μm flux could be measured (0.77 Jy) and for which no bibliographical entries exist.
19590315-2215516: our high-SNR observation permitted us to measure an accurate angular diameter of 2.35 mas for this star (HD 189075). There is no literature found in the Simbad database for this K2/K3 III star, but there is plentiful photometric information for us to derive a reddening correction of E(J − H) = 0.132 and E(H − Ks) = 0.088, giving intrinsic colors of (J − H)0 = 0.699 and (H − Ks)0 = 0.13 mag which are consistent with a K2/K3III star (Bessell & Brett 1988). Adopting (B − V)0 = 1.16 mag, the observed V = 9.18 mag and (B − V) of 1.52 mag, and the standard value R = AV/E(B − V) = 3.1, we infer AV = 1.1 mag which in turn yields a distance of ≈330 pc. Our measured angular size hence corresponds to a diameter of 165 R⊙ which, given the various parameter uncertainties, agrees reasonably with the expected size of the star.
20402960-1640247: this coincides with BD-17 6053, which has photometric measurements suggesting a mid- to late-type dwarf. There is no Simbad literature reference. Our observation revealed for the first time a companion with projected separation of 8.9 mas, almost 4 mag fainter in the K band, and which will be a difficult target for any other technique.
3.2. Resolved sources without known cross-identifications
The remaining sources in Tables 2, 3 have no known cross-identification in the Simbad database. They include 8 new binary stars, with projected separations between 6.8 and 57.8 mas. Based on 2MASS magnitude and brightness ratio, the faintest companion has K = 12.7 mag. We provide in Fig. 2 an example of the detection of a binary star both by the model-independent and by the model-dependent analysis. We detect 10142407+0843549 as as a first-time triple star, with components having magnitudes K = 10.29, 10.66 and 11.68, respectively. The projected AB and AC separations are 9.2 and 21.4 mas. For this star, like almost all other binaries, follow-up studies will be extremely difficult since the combination of separation and magnitudes are beyond the current capabilities of either long-baseline interferometry or AO-assisted single telescopes.
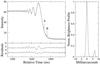 |
Fig. 2 Left: upper panel, data (dots) and best fit (solid line) for 2MASS 17073892-2554521. The lower panel shows, on an enlarged scale and displaced by arbitrary offsets for clarity, the residuals of the fits by a point-like (above) and by a binary star model (below) as listed in Table 2. The normalized χ2 values are 2.8 and 1.2, respectively. The times of the geometrical occultation of two stars are also marked, with their difference corresponding to a separation of 7 mas. Right: brightness profile reconstructed by the model-independent CAL method. |
We also detect 17184190-2716075 to be resolved, with a size of 3.74 mas in the uniform-disk (UD) sense. The CAL profile for this source shows faint circumstellar emission extending at least 10 mas from the central star, possibly asymmetric. We interpret this as the signature of a circumstellar shell and therefore the UD diameter becomes less meaningful. There is no spectral classification available, but we note that the 2MASS colors for this star are extremely red (J − K = 4 mag) and consistent with the presence of local extinction. Further studies are warranted.
3.3. Unresolved sources and performance
We have used the same χ2-based procedure adopted in Papers I − II to compute upper limits on the angular size of 177 unresolved sources. This number includes the individual components of the binary and triple stars. In the present paper we provide the corresponding plot on a logarithmic scale in Fig. 3, confirming a clear dependence of the limiting angular resolution on the SNR. In summary, the angular resolution against SNR follows a log − log relation, with the former being ≲0.6 mas for SNR ≥ 100. At the faint end, the angular resolution is ≈5 mas for SNR = 10. The scatter is significant, and is due among other factors to the dependence of the light curves quality on the phase of the Moon and on whether and when an active optics correction had been performed prior to the observations. A few additional stars resulted to be formally marginally resolved, but the associated errorbars did not provide reliable evidence compared to the general scatter of Fig. 3. The three sources that we found to be resolved are also plotted, showing that they lie clearly above the scatter of the mean relationship.
The measured counts follow a relationship which is very close to the predicted ISAAC performance according to its exposure time calculator, as was discussed in Papers I − II. This relationship is maintained from the bright to the faint end over about 8.5 mag, with only a few discrepancies in the direction of fainter fluxes only, and with mostly well understood reasons such as occasional very bad image quality due to our need to stop the active mirror corrections during LO observations. This confirms our conclusion stated in Paper II, that in the vicinity of the Galactic Center the main reason for the marked scatter in measured counts against 2MASS fluxes was probably due to intrinsic variability of the sources.
The large number of unresolved sources resulting from our observations, including Papers I − II, can be of interest for some applications such as the search for reliable interferometric calibrators with accurate upper limits on the size. We intend to prepare in the near future such a list, where we will also flag current interferometric calibrators that we have found to have companions.
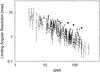 |
Fig. 3 Sources for which an upper limit on the angular diameter could be established using the method already adopted in Papers I − II are marked with the smaller dots and their errorbars. The three larger circles are the sources which we found to be resolved, with errorbars too small to be visible on this scale. |
4. Conclusions
We have extended the near-IR lunar occultation observations at the ESO VLT using the ISAAC instrument in burst mode with high time resolution, first reported in Papers I − II. In the present paper we have described the first-time implementation of such observations in service mode as a filler program. For this, a large database of predicted events was prepared, and staff astronomers on the site would select one whenever a short gap of time (≈5 min) was available.
A total of 191 stars were measured in this fashion between March 2008 and September 2009, leading to the discovery of 15 new binaries and 2 new triple stars. An additional star is a well-known binary, for which we confirm the orbital predictions and provide a high-accuracy brightness ratio in the near-IR. We also determined for the first time uniform-disk sizes for three stars, one of which is likely a star with compact circumstellar emission.
We have confirmed the performance of this technique already presented in the previous papers. With the ability to separate binary stars as close as very few milliarcseconds, with flux ratios exceeding 5 mag, and a limiting sensitivity close to K = 12.5 mag, the LO method at the ESO VLT addresses a parameter space for binary stars not easily available with other techniques. In spite of the random, fixed-time nature of the events and thanks to the very economical use of telescope resources, LO are a competitive technique especially for serendipitous discoveries of binary stars, and are ideally suited for service mode observations.
Acknowledgments
A.R. wishes to thank the National Astronomical Research Institute of Thailand, where he worked on the data used in this paper, under support from the ESO Director General’s Discretionary Fund. O.F. is partially supported by MCYT-SEPCYT Plan Nacional I+D+I AYA#2008-01225. We are
grateful to Dr. E. Horch for his valuable comments on the speckle measurements of 17 Lib. This research made use of the Simbad database, operated at the CDS, Strasbourg, France, and of data products from the Two Micron All Sky Survey, which is a joint project of the University of Massachusetts and the Infrared Processing and Analysis Center/California Institute of Technology, funded by the National Aeronautics and Space Administration and the National Science Foundation.
References
- Bartkevicius, A., & Gudas, A. 2001, Baltic Astron., 10, 481 [NASA ADS] [Google Scholar]
- Bessell, M. S., & Brett, J. M. 1988, PASP, 100, 1134 [NASA ADS] [CrossRef] [Google Scholar]
- Cutri, R. M., Skrutskie, M. F., van Dyk, S., et al. 2003, The IRSA 2MASS All-Sky Point Source Catalog, NASA/IPAC Infrared Science Archive [Google Scholar]
- de Medeiros, J. R., & Mayor, M. 1995, A&A, 302, 745 [NASA ADS] [Google Scholar]
- Dommanget, J., & Nys, O. 2002, VizieR Online Data Catalog, 1269, [Google Scholar]
- Eggen, O. J. 1998, AJ, 115, 2397 [NASA ADS] [CrossRef] [Google Scholar]
- Famaey, B., Jorissen, A., Luri, X., et al. 2005, A&A, 430, 165 [NASA ADS] [CrossRef] [EDP Sciences] [Google Scholar]
- Fors, O., Richichi, A., Otazu, X., & Nunez, J. 2008, A&A, 480, 297 [NASA ADS] [CrossRef] [EDP Sciences] [Google Scholar]
- Gondoin, P. 1999, A&A, 352, 217 [NASA ADS] [Google Scholar]
- Hartkopf, W. I., Mason, B. D., Wycoff, G. L., & McAlister, H. A. 2010, (4IC), http://ad.usno.navy.mil/wds/int4.html [Google Scholar]
- Heintz, W. D. 1987, ApJS, 65, 161 [NASA ADS] [CrossRef] [Google Scholar]
- Mérand, A., Bordé, P., & Coudé du Foresto, V. 2005, A&A, 433, 1155 [NASA ADS] [CrossRef] [EDP Sciences] [Google Scholar]
- Piters, A. J. M., van Paradijs, J., & Schmitt, J. H. M. M. 1998, A&AS, 128, 29 [Google Scholar]
- Richichi, A. 1989, A&A, 226, 366 [NASA ADS] [Google Scholar]
- Richichi, A., Baffa, C., Calamai, G., & Lisi, F. 1996, AJ, 112, 278 [NASA ADS] [CrossRef] [Google Scholar]
- Richichi, A., Percheron, I., & Khristoforova, M. 2005, A&A, 431, 773 [NASA ADS] [CrossRef] [EDP Sciences] [Google Scholar]
- Richichi, A., Fors, O., Mason, E., Stegmeier, J., & Chandrasekhar, T. 2008a, A&A, 489, 1399 (Paper I) [NASA ADS] [CrossRef] [EDP Sciences] [Google Scholar]
- Richichi, A., Fors, O., & Mason E., 2008b, A&A, 489, 1441 (Paper II) [NASA ADS] [CrossRef] [EDP Sciences] [Google Scholar]
- Terzan, A., & Ounnas, C. 1988, A&AS, 76, 205 [Google Scholar]
- Wilson, R. E., & Joy, A. H. 1950, ApJ, 111, 221 [NASA ADS] [CrossRef] [Google Scholar]
All Tables
All Figures
|
Fig. 1 Top panel: data (dots) and best fit (solid line) for 17151916-2730178. The lower panel shows, on an enlarged scale and displaced by arbitrary offsets for clarity, the residuals of the fits by a point-like (above, reduced χ2 = 2.2) and a resolved uniform-disk model (below, reduced χ2 = 1.0) as listed in Table 3. |
| In the text | |
|
Fig. 2 Left: upper panel, data (dots) and best fit (solid line) for 2MASS 17073892-2554521. The lower panel shows, on an enlarged scale and displaced by arbitrary offsets for clarity, the residuals of the fits by a point-like (above) and by a binary star model (below) as listed in Table 2. The normalized χ2 values are 2.8 and 1.2, respectively. The times of the geometrical occultation of two stars are also marked, with their difference corresponding to a separation of 7 mas. Right: brightness profile reconstructed by the model-independent CAL method. |
| In the text | |
|
Fig. 3 Sources for which an upper limit on the angular diameter could be established using the method already adopted in Papers I − II are marked with the smaller dots and their errorbars. The three larger circles are the sources which we found to be resolved, with errorbars too small to be visible on this scale. |
| In the text | |
Current usage metrics show cumulative count of Article Views (full-text article views including HTML views, PDF and ePub downloads, according to the available data) and Abstracts Views on Vision4Press platform.
Data correspond to usage on the plateform after 2015. The current usage metrics is available 48-96 hours after online publication and is updated daily on week days.
Initial download of the metrics may take a while.