Free Access
Fig. 4
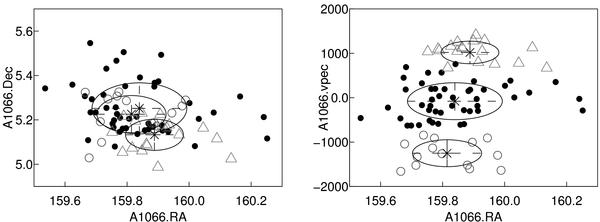
Left panel shows RA vs. Dec, the right panel RA vs. peculiar velocities of galaxies (in km s-1) in the cluster A1066. Different symbols correspond to three different velocity components (see text), ellipses show the covariances of the components.
Current usage metrics show cumulative count of Article Views (full-text article views including HTML views, PDF and ePub downloads, according to the available data) and Abstracts Views on Vision4Press platform.
Data correspond to usage on the plateform after 2015. The current usage metrics is available 48-96 hours after online publication and is updated daily on week days.
Initial download of the metrics may take a while.