Fig. 8
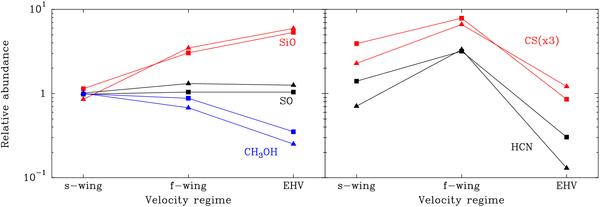
Variation of CO-normalized abundances over the three outflow regimes. Values are set to unity in the s-wing regime to better illustrate their change across the outflow. Squares represent L1448 data and triangles represent I04166 data. Note the good agreement between the two outflows and the systematic differences between the species. The CS data have been multiplied by 3 to avoid overlap with the HCN curve.
Current usage metrics show cumulative count of Article Views (full-text article views including HTML views, PDF and ePub downloads, according to the available data) and Abstracts Views on Vision4Press platform.
Data correspond to usage on the plateform after 2015. The current usage metrics is available 48-96 hours after online publication and is updated daily on week days.
Initial download of the metrics may take a while.