Fig. 5
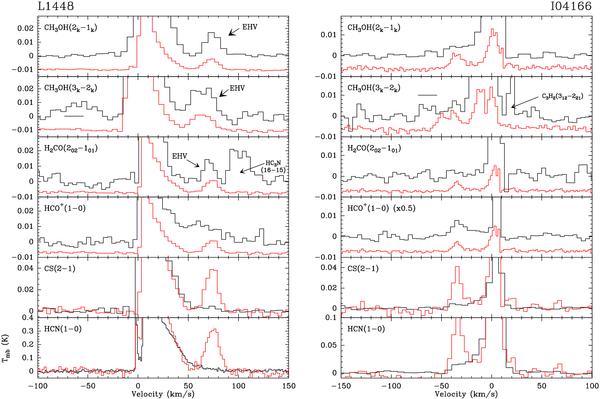
Evidence for EHV emission in CH3OH and H2CO towards the L1448 outflow, together with possible detections in HCO+, CS, and HCN. The black histograms represent the data and the red histograms are scaled-down SO(32 − 21) spectra to illustrate the expected location of the EHV peak (near VLSR = 70 km s-1 in L1448 and near − 35 km s-1 in I04166). For CH3OH and HCN, the red histogram is a synthetic spectrum derived using the SO(32 − 21) line as a template (see Appendix C for further details). Note the weak EHV peaks and the gradual transition from well defined secondary components in CH3OH and H2CO to more wing-like features in HCO+, CS, and HCN. Several unrelated lines are indicated, and the horizontal lines in the CH3OH(3k − 2k) spectra mark the position of weak k = 2 components that may contaminate the EHV feature in I04166. See text for a discussion of the reliability of each detection. SO was chosen as a template due to its similar behavior to CO and higher sensitivity to dense gas.
Current usage metrics show cumulative count of Article Views (full-text article views including HTML views, PDF and ePub downloads, according to the available data) and Abstracts Views on Vision4Press platform.
Data correspond to usage on the plateform after 2015. The current usage metrics is available 48-96 hours after online publication and is updated daily on week days.
Initial download of the metrics may take a while.