Fig. 3
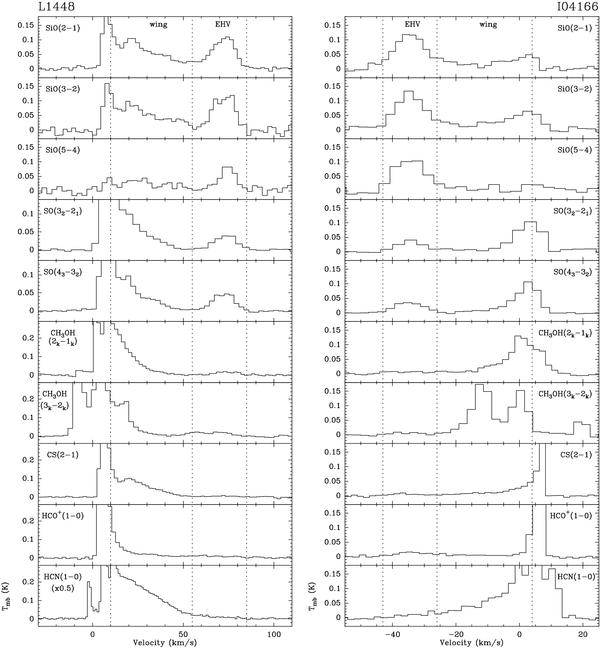
Spectra from the high density tracers with detected outflow emission in the L1448 (left) and I04166 (right) survey targets. As in Fig. 2, the vertical dotted lines mark the boundaries of the wing and EHV outflow regimes. Note the prominent EHV features in the SiO and SO lines, and the prominent wings of lines from other species like HCN. Note also how the outflow regimes partly overlap in the multicomponent spectra of CH3OH. The analysis used to disentangle these components is described in Appendix C.
Current usage metrics show cumulative count of Article Views (full-text article views including HTML views, PDF and ePub downloads, according to the available data) and Abstracts Views on Vision4Press platform.
Data correspond to usage on the plateform after 2015. The current usage metrics is available 48-96 hours after online publication and is updated daily on week days.
Initial download of the metrics may take a while.