Fig. 2
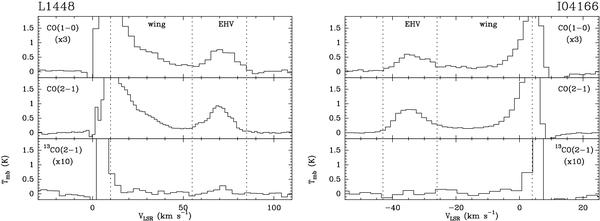
CO(J = 1 − 0), CO(2–1), and 13CO(2 − 1) spectra towards the target positions of the molecular survey in the L1448 (left) and I04166 (right) outflows. The intensity scale of the spectra has been truncated to better show the two velocity components of the outflow, the “wing” and the EHV regime, whose limits are indicated by vertical dotted lines. Negative features near the ambient velocity of each source (VLSR = 5.0 km s-1 in L1448 and 6.7 km s-1 in I04166) are artifacts of the wobbler switch observing mode, and do not affect the outflow emission studied here.
Current usage metrics show cumulative count of Article Views (full-text article views including HTML views, PDF and ePub downloads, according to the available data) and Abstracts Views on Vision4Press platform.
Data correspond to usage on the plateform after 2015. The current usage metrics is available 48-96 hours after online publication and is updated daily on week days.
Initial download of the metrics may take a while.