Fig. B.1
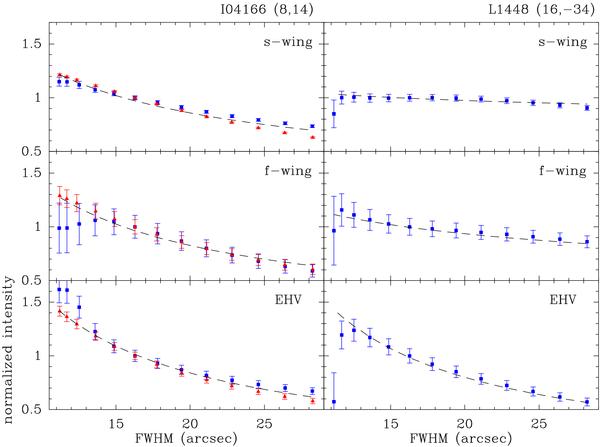
Variation of the CO(2 − 1) integrated
intensity as a function of total convolving beam size (normalized to the 16′′ value)
for the three outflow velocity regimes used in the molecular survey. The intensities
have been determined by convolving appropriately either IRAM 30 m Nyquist-sampled
maps (blue squares) or a combined Plateau de Bure interferometer+30 m data set (red
triangles). The dashed lines represent a set of fits with the form
 that have
been used to correct the survey data for beam dilution effects (see text). The error
bars represent the estimated 1-σ rms and have been calculated from
the noise in the spectra using a baseline fit to the line-free channels.
that have
been used to correct the survey data for beam dilution effects (see text). The error
bars represent the estimated 1-σ rms and have been calculated from
the noise in the spectra using a baseline fit to the line-free channels.
Current usage metrics show cumulative count of Article Views (full-text article views including HTML views, PDF and ePub downloads, according to the available data) and Abstracts Views on Vision4Press platform.
Data correspond to usage on the plateform after 2015. The current usage metrics is available 48-96 hours after online publication and is updated daily on week days.
Initial download of the metrics may take a while.