Free Access
Fig. A.1
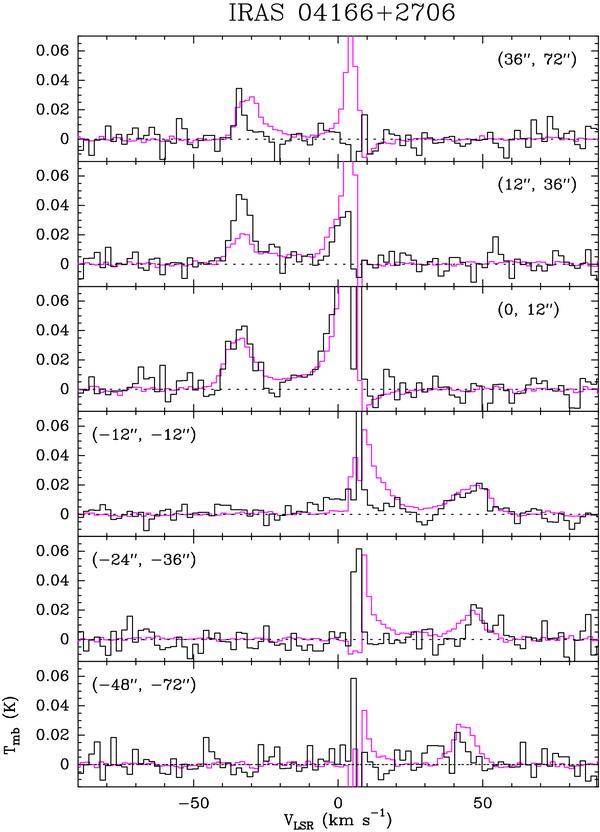
SO(32 − 21) (black) and CO(2 − 1) (red) spectra along the central axis of the I04166 outflow. The CO spectra have been scaled down by a factor of 20, and the offsets are referred to the IRAS nominal position (α(J2000) = 4h19m42ṣ6, δ(J2000) = +27°13′38′′).
Current usage metrics show cumulative count of Article Views (full-text article views including HTML views, PDF and ePub downloads, according to the available data) and Abstracts Views on Vision4Press platform.
Data correspond to usage on the plateform after 2015. The current usage metrics is available 48-96 hours after online publication and is updated daily on week days.
Initial download of the metrics may take a while.