Fig. 11
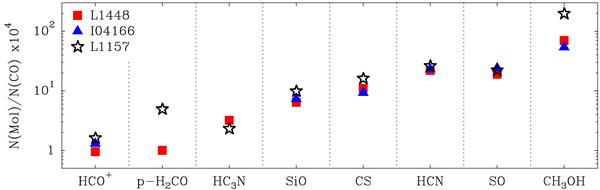
Comparison between CO-normalized outflow abundances in L1448 (red squares), I04166 (blue triangles) and L1157 (open stars) for all species detected in the molecular survey. Note the good agreement (better than a factor of two) for most species. See text for a discussion on the discrepancies in H2CO and CH3OH. For all sources, f-wing regime values have been used.
Current usage metrics show cumulative count of Article Views (full-text article views including HTML views, PDF and ePub downloads, according to the available data) and Abstracts Views on Vision4Press platform.
Data correspond to usage on the plateform after 2015. The current usage metrics is available 48-96 hours after online publication and is updated daily on week days.
Initial download of the metrics may take a while.