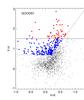
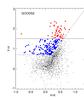
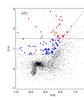
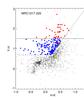
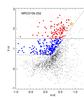
Fig. 8

Colour–colour diagrams Y−H vs. H−K for all the fields : Top panels: control fields: GOODS1 (left), GOODS2 (middle) and CF2 (right). Bottom panels: HzRG fields: MRC 1017-220 (left) and MRC 0156-252 (right). We plot galaxies detected down to the 2σ detection limits in Y, H and Ks (black dots). r-YHK and b-YHK galaxies are designed by red and blue circles. Arrows indicate lower limits for sources detected in H and Ks but not in Y. The radio galaxies are marked by the yellow stars in the bottom panels. We also indicate with black open squares the two EROs found in the field of MRC 1017-220 (bottom left panel, Cimatti et al. 1999) and the two sources found within 5″ of MRC 0156-252 (bottom right panel) corresponding to objects B (the b-YHK galaxy) and C (the r-YHK galaxy) in Fig. 9.
Current usage metrics show cumulative count of Article Views (full-text article views including HTML views, PDF and ePub downloads, according to the available data) and Abstracts Views on Vision4Press platform.
Data correspond to usage on the plateform after 2015. The current usage metrics is available 48-96 hours after online publication and is updated daily on week days.
Initial download of the metrics may take a while.