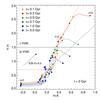
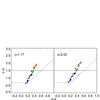
Fig. 5

Bruzual & Charlot (2003) model predictions of different stellar populations in a Y−H vs. H−K colour − colour diagram (see text for details on the models). The dashed line accounts for the two-colour selection designed to isolate galaxies at z > 1.6. The horizontal line (Y−H > 1.5) shows the single-colour selection to separate red passively evolving galaxies (r-YHK galaxies) from star forming ones (b-YHK galaxies). We assume an exponential declining star formation history with τ = 0.1, 0.3, 0.5, 0.7, 1 and 5 Gyr (see legend). Top: for increasing redshifts (z = 0 to z = 3, each 0.5 bin marked by coloured points) and a constant age of 2 Gyr, the stars corresponding to z = 1.77. The black arrow indicates the reddening vector E(B−V) = 0.2 as parameterized by Cardelli et al. (1989). Bottom: for various population ages (t = 1.5, 2, 2.5, 2.75 Gyr, coloured points with Y−H getting redder with ages) at z = 1.77 and z = 2.02.
Current usage metrics show cumulative count of Article Views (full-text article views including HTML views, PDF and ePub downloads, according to the available data) and Abstracts Views on Vision4Press platform.
Data correspond to usage on the plateform after 2015. The current usage metrics is available 48-96 hours after online publication and is updated daily on week days.
Initial download of the metrics may take a while.