Fig. 5
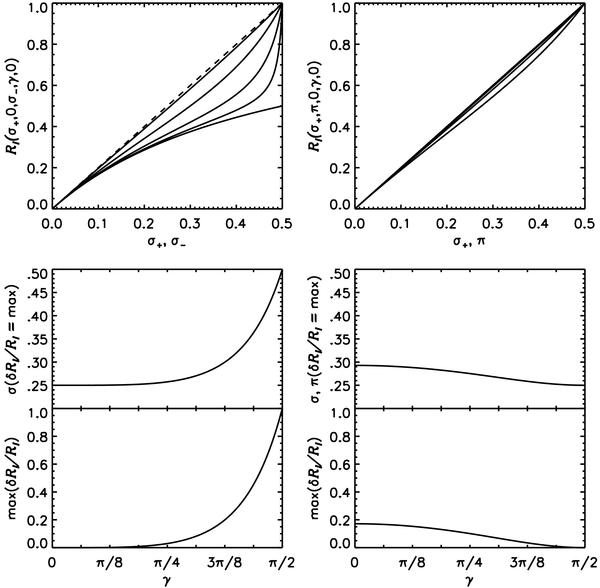
Behaviour of RI, ± (σ+ + σ−, left panels), and RI, + 0 (σ+ + π0, right panels). Top panels: the resulting blend depth when both components have equal depth (abscissa values) for different angles γ ranging from π/4 to π/2 (top to bottom solid lines). The dashed line represents the linear sum of the two components. Middle panels: component depth for which the relative error with respect to the linear approximation δRI/RI is largest, depending on the angle γ. Lower panels: maximum relative errors δRI/RI as a function of γ. See text for detailed discussion.
Current usage metrics show cumulative count of Article Views (full-text article views including HTML views, PDF and ePub downloads, according to the available data) and Abstracts Views on Vision4Press platform.
Data correspond to usage on the plateform after 2015. The current usage metrics is available 48-96 hours after online publication and is updated daily on week days.
Initial download of the metrics may take a while.