Free Access
Fig. 6
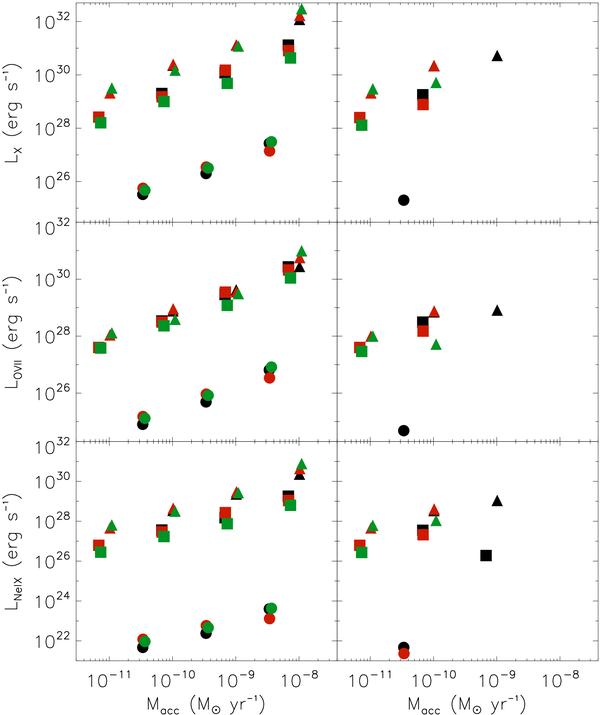
Luminosities in the [0.5−8.0] keV band (top panels) and in the resonance lines of the O vii (middle-panels) and Ne ix (bottom panels) as function of the mass accretion rates. Absorption from the stellar chromosphere is considered only for the results reported on right panels. Symbols and colors as in Fig. 4.
Current usage metrics show cumulative count of Article Views (full-text article views including HTML views, PDF and ePub downloads, according to the available data) and Abstracts Views on Vision4Press platform.
Data correspond to usage on the plateform after 2015. The current usage metrics is available 48-96 hours after online publication and is updated daily on week days.
Initial download of the metrics may take a while.