Fig. 4
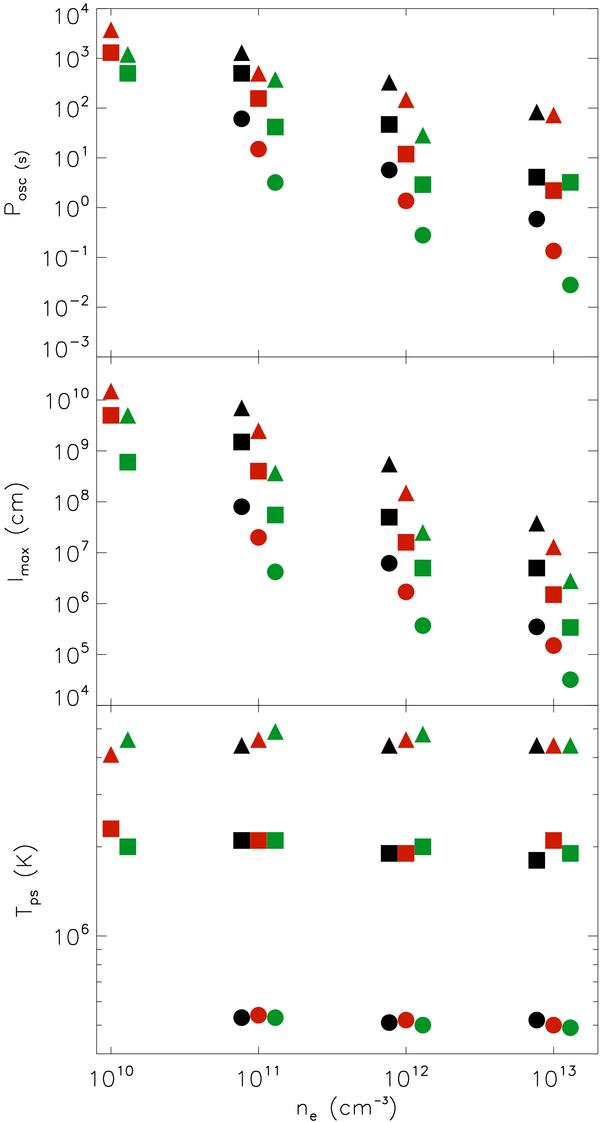
Periods of the shock oscillations (Posc, upper panel), maximum extension of the post-shock zone (lmax, middle panel) and the emission-measure-weighted temperature (Tps, bottom panel) of all the cases investigated. The labels on the x-axis of the bottom panel indicate the densities of accretion stream. Different symbols indicate different velocities: uacc = 200 (circle), 400 (squares), and 600 (triangles) km s-1. Different colors indicate different metal abundances: ζ = 0.2 (black), 1.0 (red) and 5.0 (green). Note that data points have been spread over each density value to prevent overlapping of the symbols.
Current usage metrics show cumulative count of Article Views (full-text article views including HTML views, PDF and ePub downloads, according to the available data) and Abstracts Views on Vision4Press platform.
Data correspond to usage on the plateform after 2015. The current usage metrics is available 48-96 hours after online publication and is updated daily on week days.
Initial download of the metrics may take a while.