Fig. 3
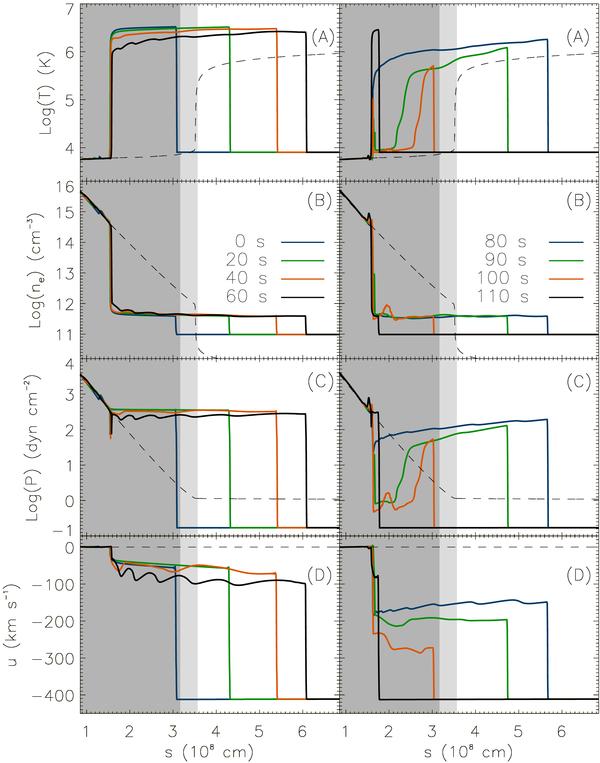
Time evolution of plasma temperature A), density B), pressure C) and velocity D) during a complete oscillation of the post-shock zone in the case of an accretion stream with density nacc = 1011 cm-3, velocity uacc = 400 km s-1 and metal abundance ζ = 1.0. The left (right) panels show the time evolution during the heating (cooling) phase. The dashed lines describe the profiles of the unperturbed initial stellar atmosphere (chromosphere and corona). The shaded areas mark the regions below the thresholds sabs used to estimate the effects of absorption on the luminosity in the O vii (pale grey) and Ne ix resonance lines (see Sect. 2.4).
Current usage metrics show cumulative count of Article Views (full-text article views including HTML views, PDF and ePub downloads, according to the available data) and Abstracts Views on Vision4Press platform.
Data correspond to usage on the plateform after 2015. The current usage metrics is available 48-96 hours after online publication and is updated daily on week days.
Initial download of the metrics may take a while.