Fig. 20
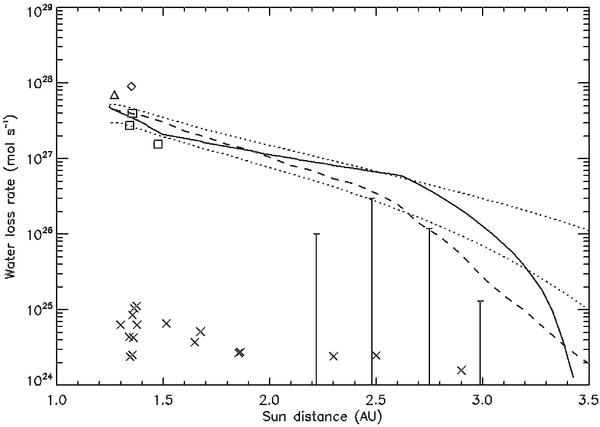
Extrapolations beyond 2 AU of 67P pre-perihelion water-loss rates. Triangle, diamond and squares: observations (Fig. 19). Symbol × : post-perihelion CN-loss rates (Schleicher 2006 at sun distances lower than 2 AU, Schulz et al. 2004) beyond). Vertical error bars: upper limits of pre-perihelion CN-loss rate (Schulz, private communication) multiplied by 103. Solid line: water-loss rate obtained by the dust-loss rate assuming a constant dust-to-gas mass ratio of 3. Dotted lines: water-loss rate predicted by Gortsas et al. (2010) assuming an active area fraction of 3% and heat conductivities of 0.1 (lower line) and 10-3 W m-1 K-1 (upper line). Dashed line: water-loss rate predicted by De Sanctis et al. (2006) rescaled to 4% their assumed active area fraction of 50% (see text for discussion, assumed heat conductivity of 3 W m-1 K-1).
Current usage metrics show cumulative count of Article Views (full-text article views including HTML views, PDF and ePub downloads, according to the available data) and Abstracts Views on Vision4Press platform.
Data correspond to usage on the plateform after 2015. The current usage metrics is available 48-96 hours after online publication and is updated daily on week days.
Initial download of the metrics may take a while.