Fig. 15
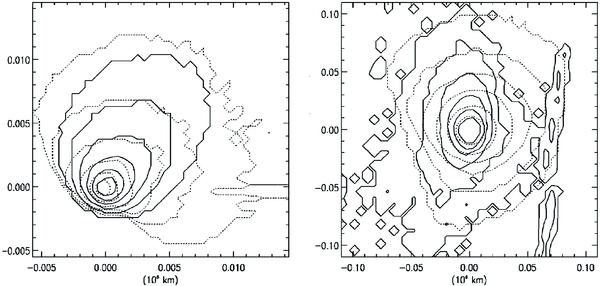
Observed (solid lines) and computed (dashed lines, seasonal ejection) isophotes on the VLT image of 2008, September 4 (left panel) and of the CARA image on 2009, January 25 (right panel) according to the Afρ curve shown in Fig. 13. The innermost isophote corresponds to Af = 1.8 × 10⁻⁷ in the right panel, with a better fit of the sunward tail than in Fig. 10; and to Af = 3 × 10⁻⁶ in the left panel, a factor 3 higher than in Fig. 6.
Current usage metrics show cumulative count of Article Views (full-text article views including HTML views, PDF and ePub downloads, according to the available data) and Abstracts Views on Vision4Press platform.
Data correspond to usage on the plateform after 2015. The current usage metrics is available 48-96 hours after online publication and is updated daily on week days.
Initial download of the metrics may take a while.