Fig. 12
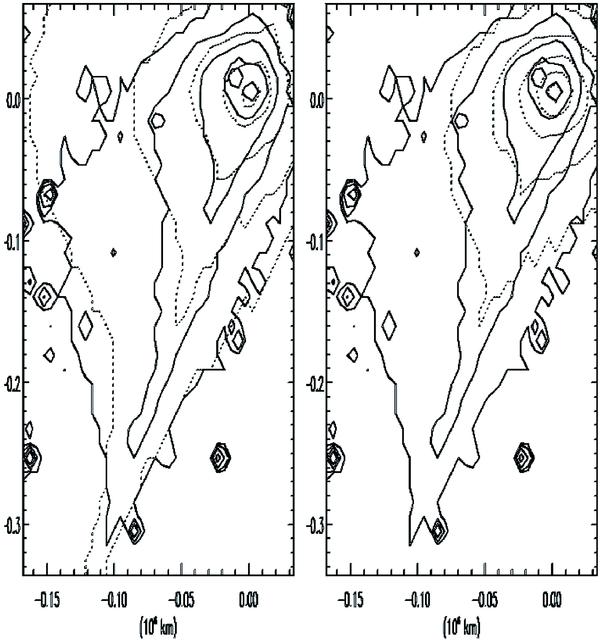
Observed (solid lines) and computed (dashed lines) isophotes of TNG image on 2003, March 27 at 2.58 AU post-perihelion. Left panel: seasonal ejection with the time-dependent size distribution shown in panel d of Fig. 3, with a power index ranging from −3.0 before perihelion to −4.2 after; isotropic ejection provided very similar fits (Fig. 4). Right panel: constant size distribution index at −3.6. The innermost isophote corresponds to Af = 10-7, the outer isophotes decrease of a factor 2 in Af. The Sun direction is along the −y axis; the north direction is in PA = 133° clockwise from +y, scale in 106 km.
Current usage metrics show cumulative count of Article Views (full-text article views including HTML views, PDF and ePub downloads, according to the available data) and Abstracts Views on Vision4Press platform.
Data correspond to usage on the plateform after 2015. The current usage metrics is available 48-96 hours after online publication and is updated daily on week days.
Initial download of the metrics may take a while.