Fig. 2
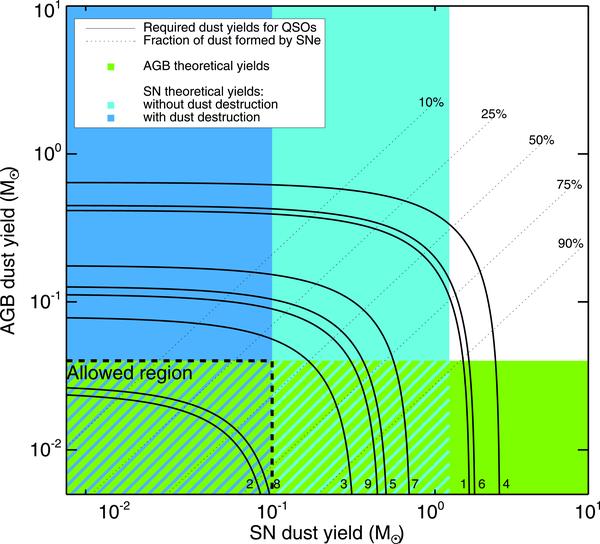
The relation of the required dust yields per AGB star and per SN for different fractions of dust formed by SNe (shown as dotted lines). This is a combination of panels in Fig. 1 relaxing the assumption that only AGB stars or only SNe produced dust in the z > 5 QSOs. The theoretically allowed regions of dust yields are shown as in Fig. 1. Hashed region outlined by the dashed line corresponds to the the allowed region, where the dust yields for both AGB stars and SNe are within theoretical limits (with the dust destruction implemented). The solid lines correspond to the z > 5 QSOs numbered as in Table 1. If higher fraction of dust is attributed to SNe then the QSOs move towards bottom-right corner. The combined effort of AGB stars and SNe can explain dust in QSO 2 and 8, but not in QSO 1, 4 and 6. Dust in QSOs 3, 5, 7 and 9 may have been formed by these stellar sources, but only if little dust is destroyed in SN shocks and that SN account for more than 50–75% of dust in these QSOs.
Current usage metrics show cumulative count of Article Views (full-text article views including HTML views, PDF and ePub downloads, according to the available data) and Abstracts Views on Vision4Press platform.
Data correspond to usage on the plateform after 2015. The current usage metrics is available 48-96 hours after online publication and is updated daily on week days.
Initial download of the metrics may take a while.